Precision Livestock Platform — Bosch
Product Design • UX Research • Field Research • Service Design • B2B • IoT • Agritech
BOSCH BRASIL (VIA INSITUM) · DESIGN RESEARCHER & UX DESIGNER
How a digital platform built for confined feedlots was tested — and reinvented — for wide pastures, where 95% of Brazil's cattle herd lives. Field research knocked down the initial business hypothesis and turned the product into decision support for the rancher.
The Context
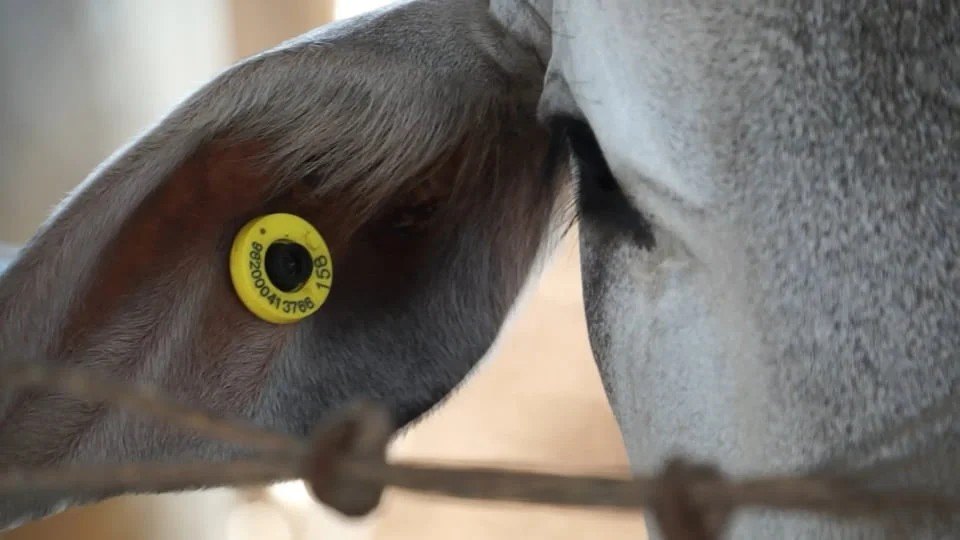
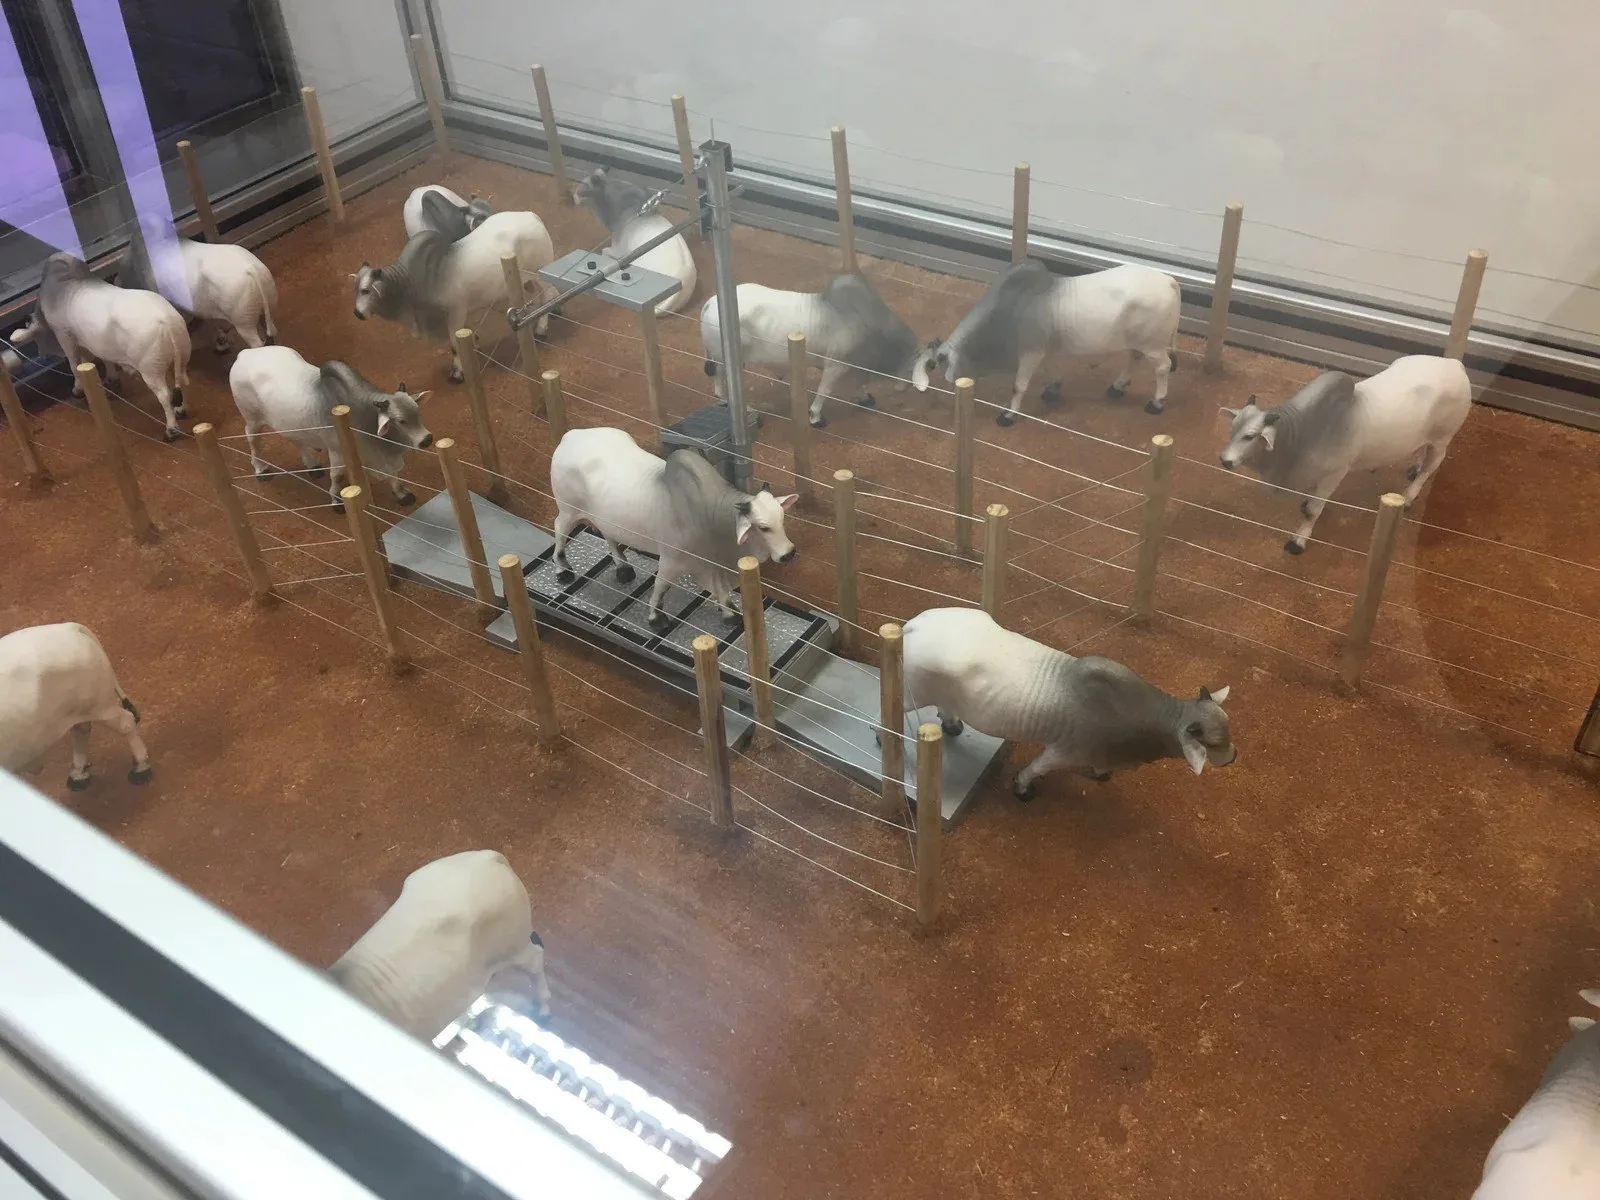
In Brazil, grass-fed beef cattle is raised under two regimes. Bosch Brazil had a digital solution for the smaller one: confined feedlots, where the herd is kept in a closed area with a feed trough, a scale and a mandatory passage point. Electronic ear tags, antennas, a scale and a platform identified each animal and recorded its weight on every pass.
It worked — but it served only 5% of the market. In extensive ranching, where 95% of Brazil's herd lives, cattle roam large paddocks and an animal is only seen when someone rides out to look. Bosch wanted to know whether the same stack could cross from one system to the other.
Summary
Field research knocked down the initial business hypothesis — automatic animal counting — and turned the product into decision support for the rancher: missing animals, daily weight and pasture rotation, in near real time.
The Challenge
Test whether Bosch's confined-system solution works in the wide-pasture system, find new fronts for precision livestock farming, and design the digital experience for what the field validated.
My Role
I worked as Design Researcher & UX Designer on the INSITUM team — leading field research with ranchers and farm staff, synthesizing the findings, co-creating solutions and designing the prototype, alongside Murilo Gomes (project lead) and Vinicius Dourado (UI design).
My Approach
The project started from a business hypothesis: the value is in automatic animal counting. Before drawing a single screen, I took that hypothesis to the farms.
Shadowing and in-depth interviews with ranchers, farm managers and ranch hands showed how the herd is actually tracked in extensive pastures — on horseback, by eye, paddock by paddock.
What do we need to learn in the field before deciding what to build?
Practical questions to plan the field research
- Who works the herd day to day?
- How does the rancher know an animal is missing?
- How are paddocks and rotation decided?
- Where does the whole herd pass every day?
- How is weight measured today?
- When is an animal ready to sell?
- What does a ranch hand's typical day look like?
- Is counting cattle a real pain?
- What does the rancher check first?
- How are connectivity and power in the field?
- What does a lost animal cost the operation?
- What would the rancher pay for?
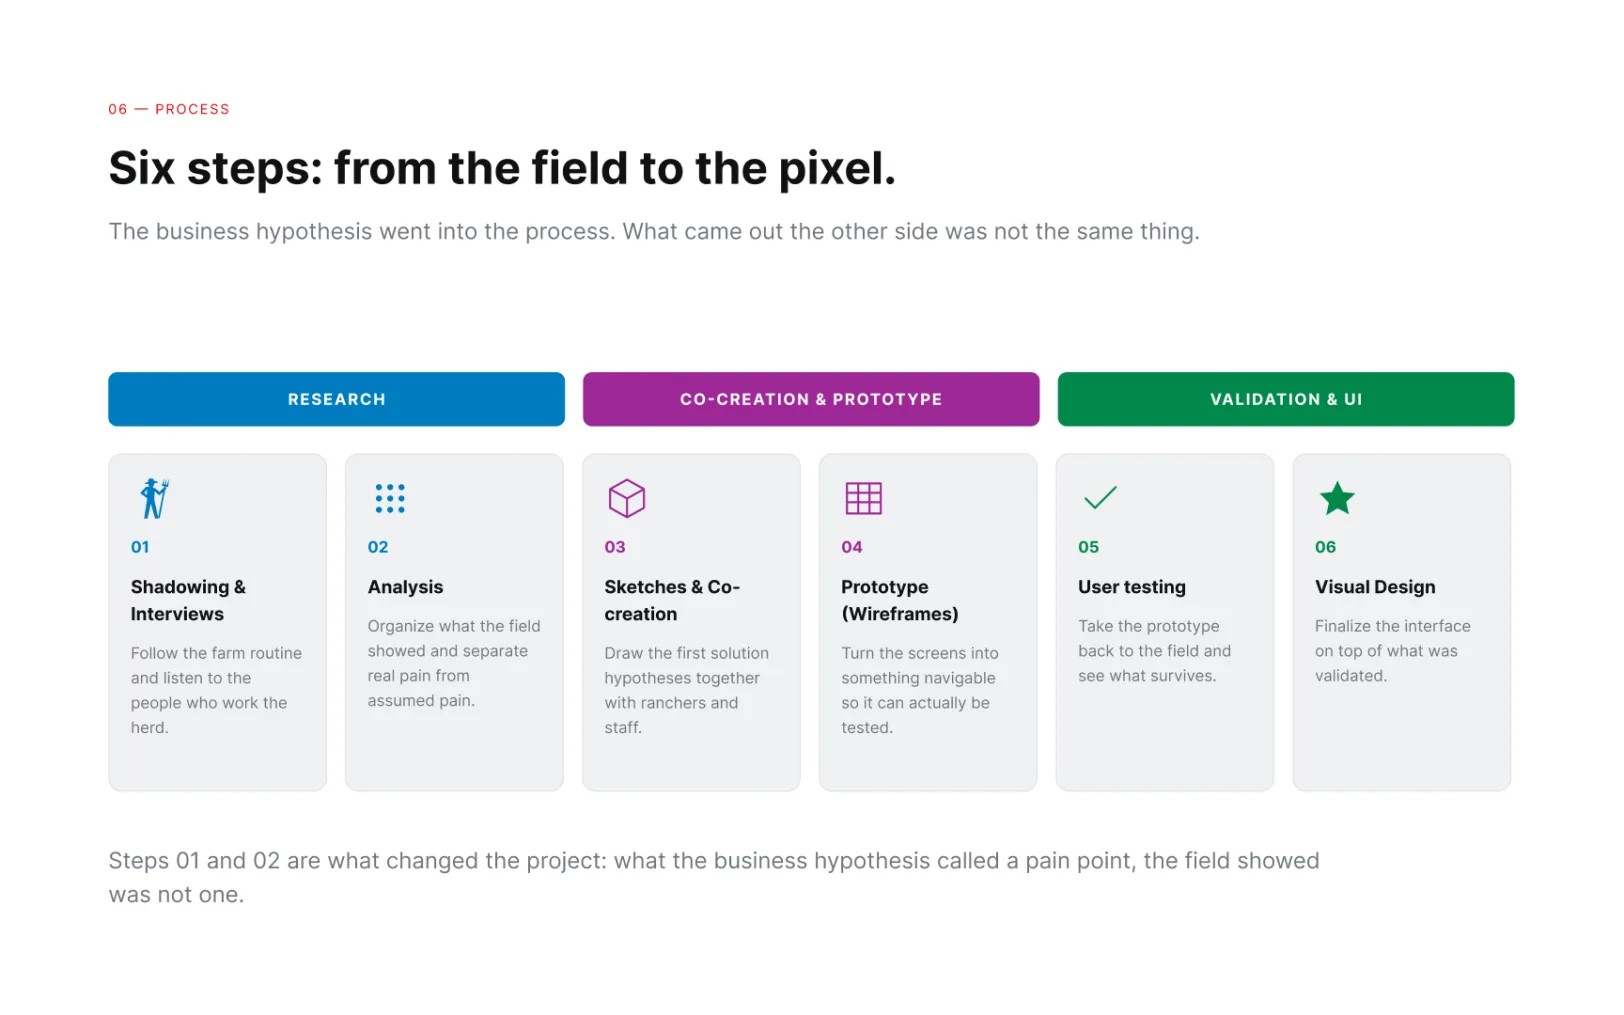
The project went from the field to the pixel in three movements:
Field research: follow the farm routine and listen to the people who work the herd.
Synthesis: organize what the field showed and separate real pain from assumed pain.
Co-creation, prototyping and field testing: draw solutions with ranchers, make them navigable and take them back to the field before finalizing the interface.
Phase 1 — Field research and shadowing
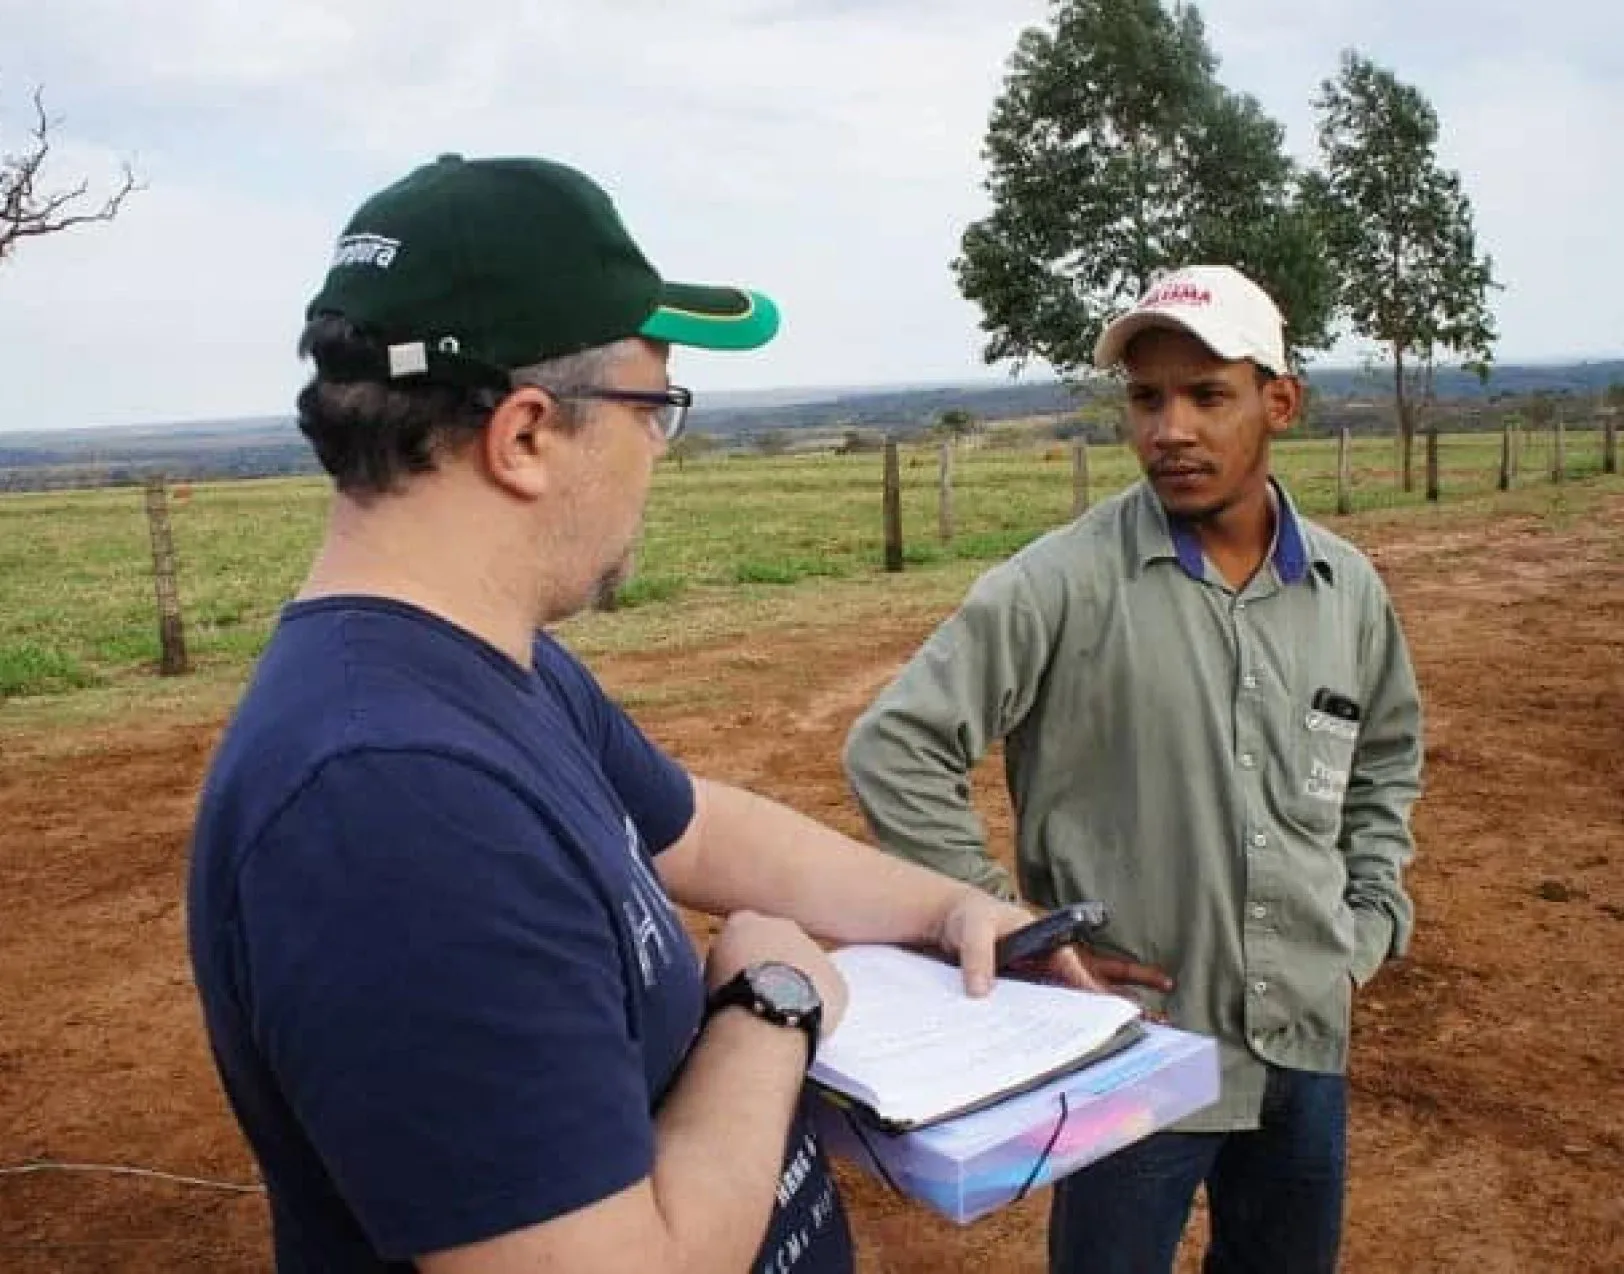
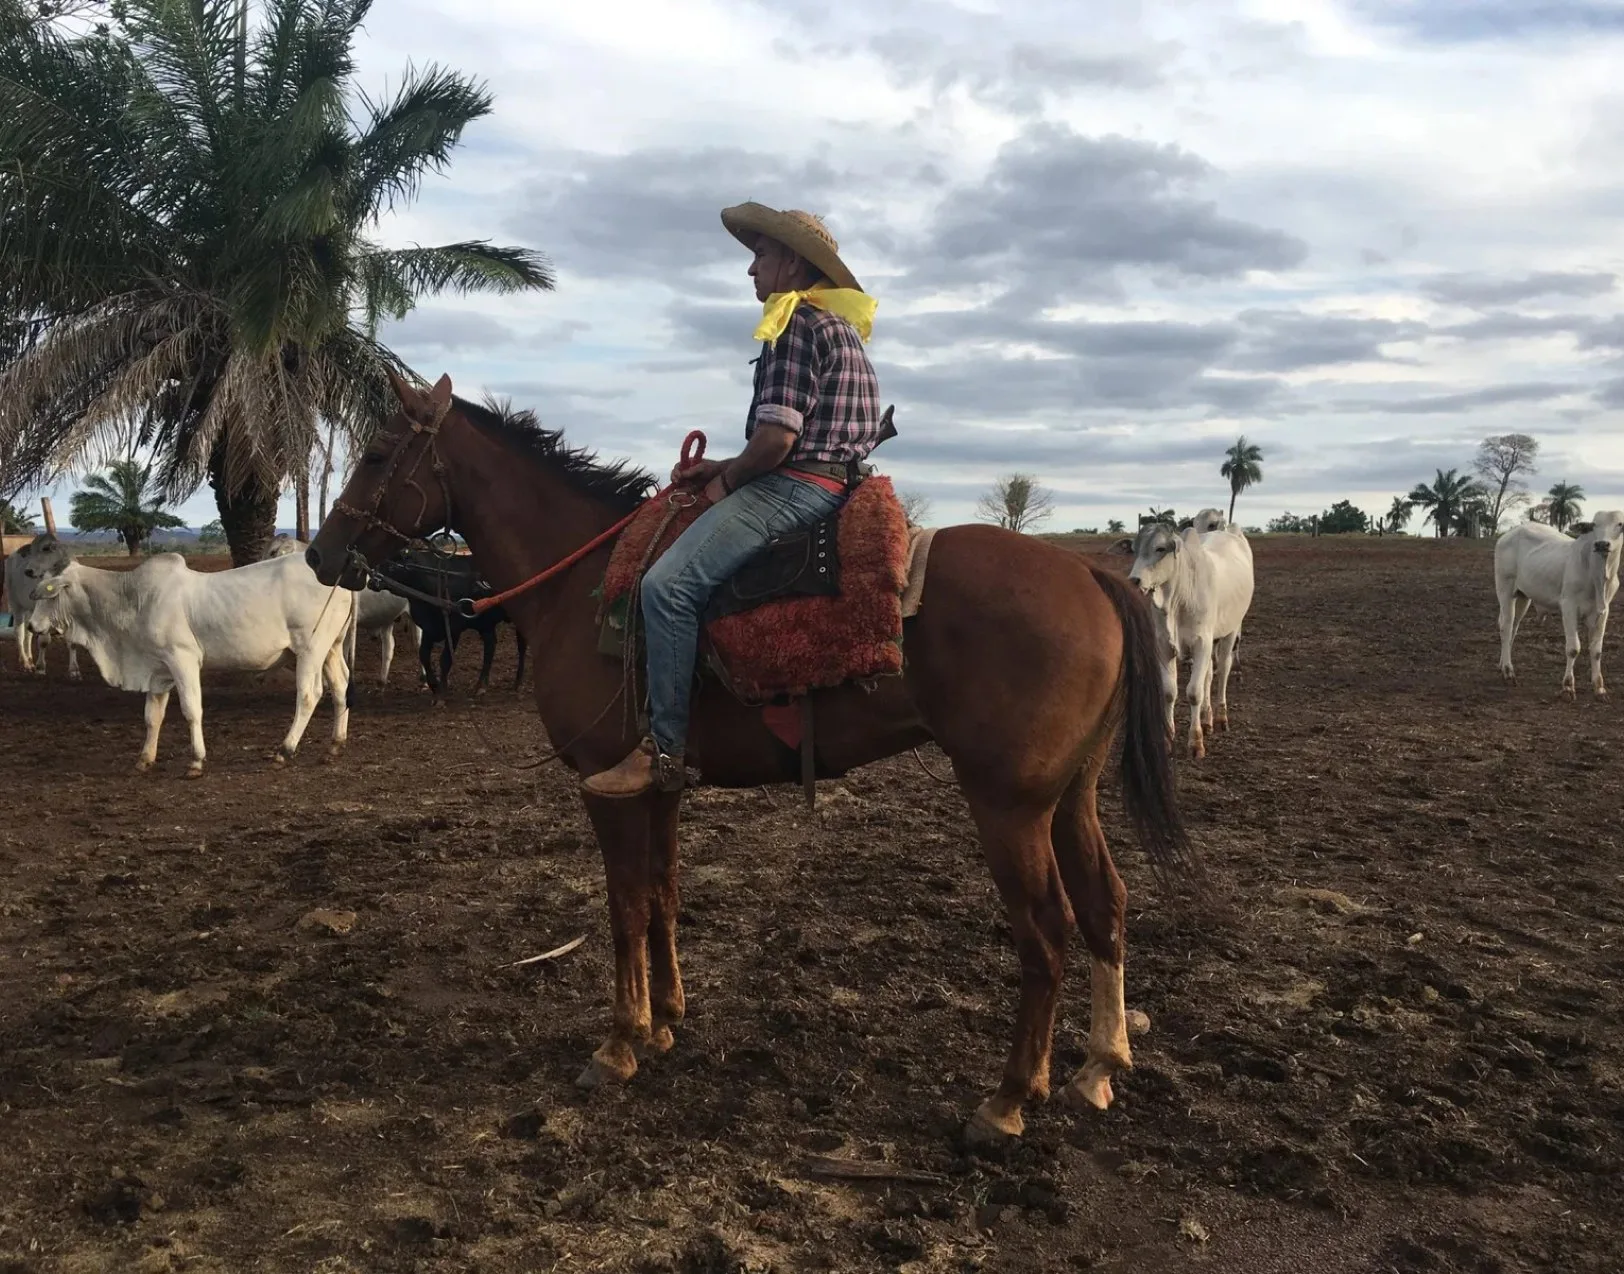
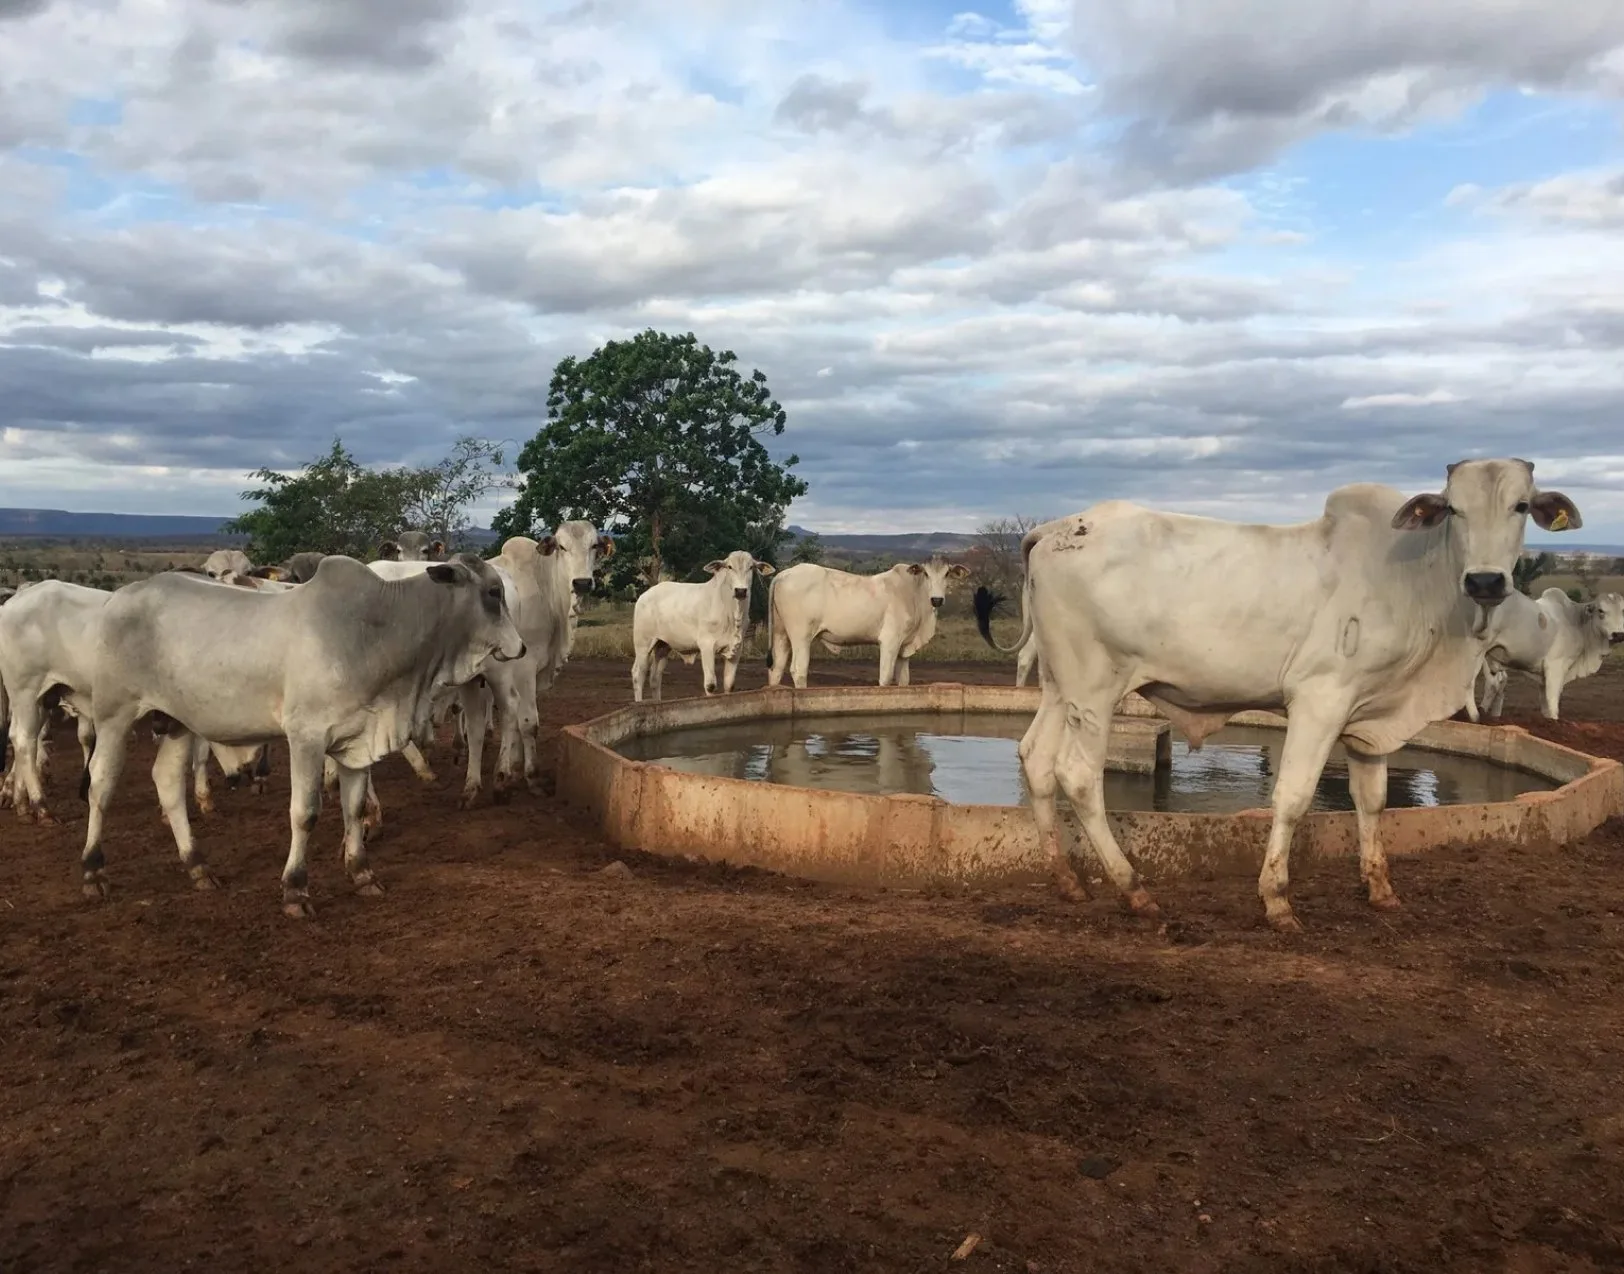
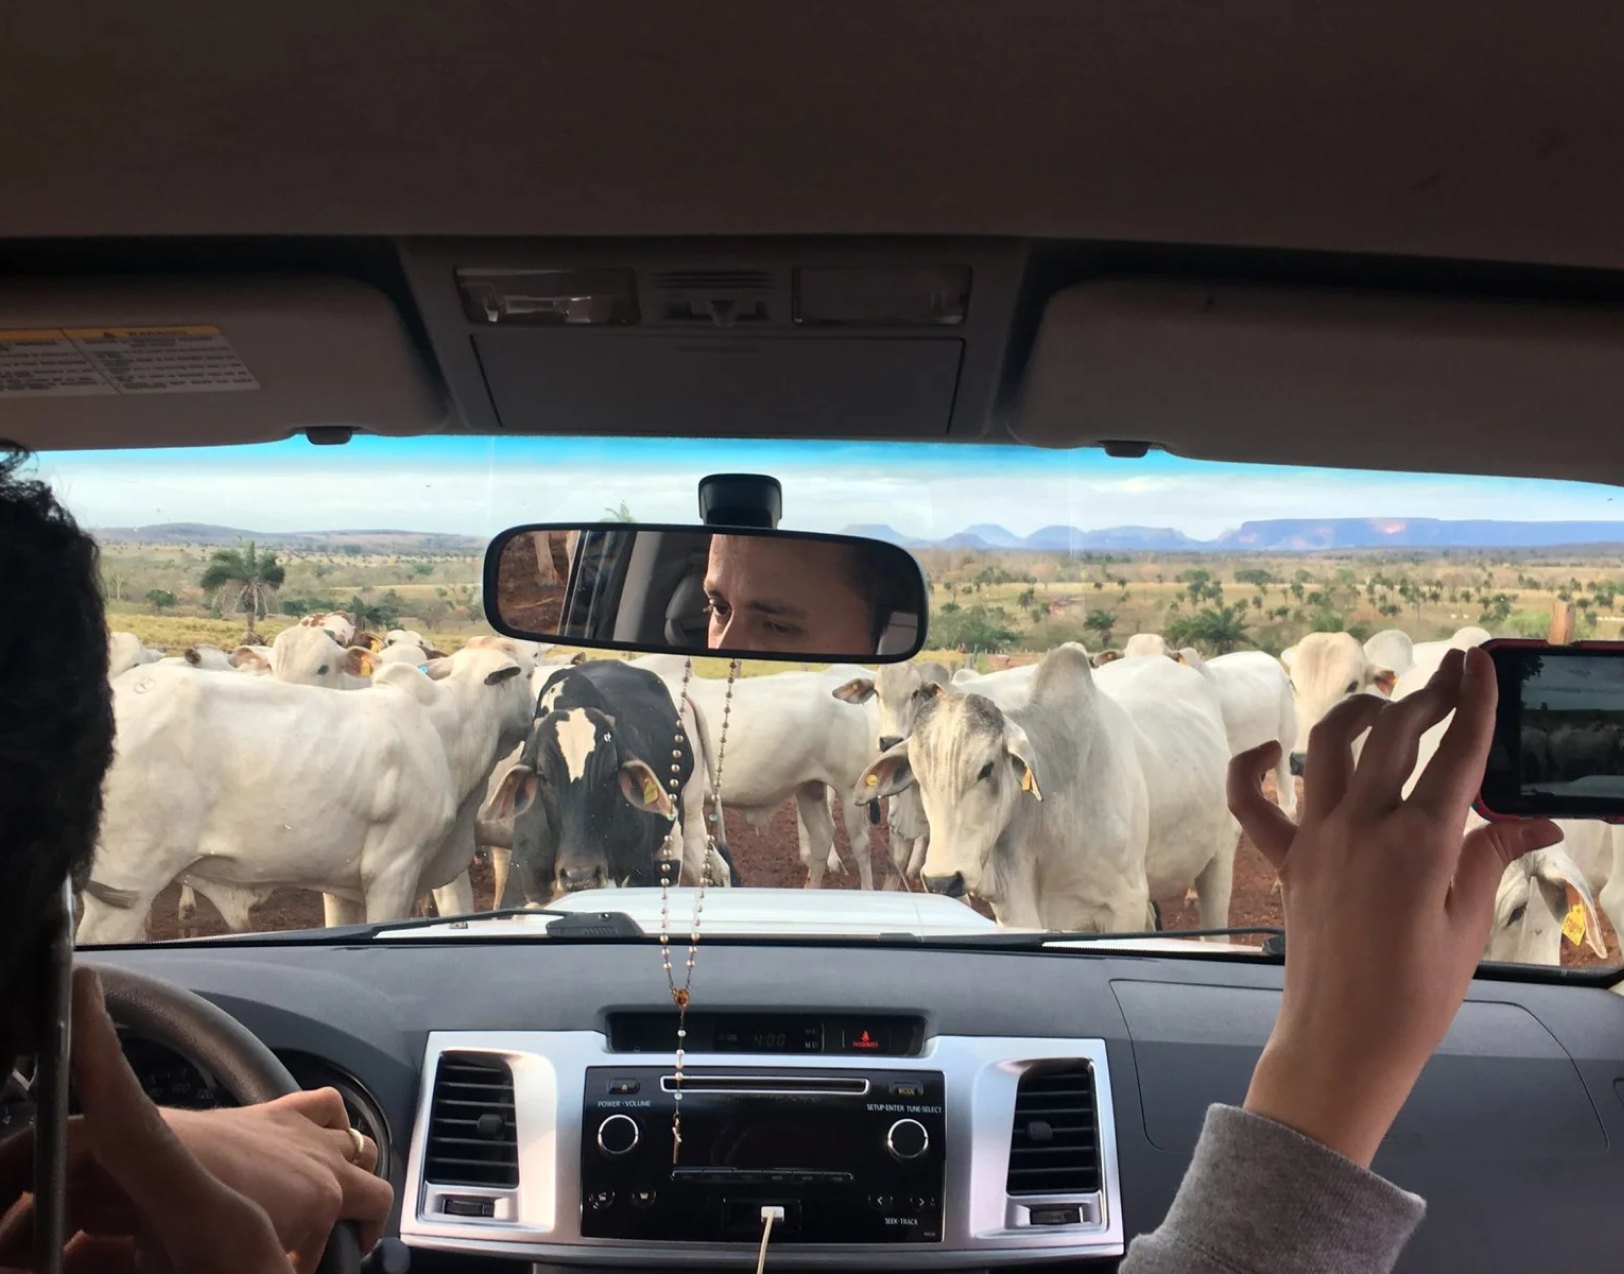
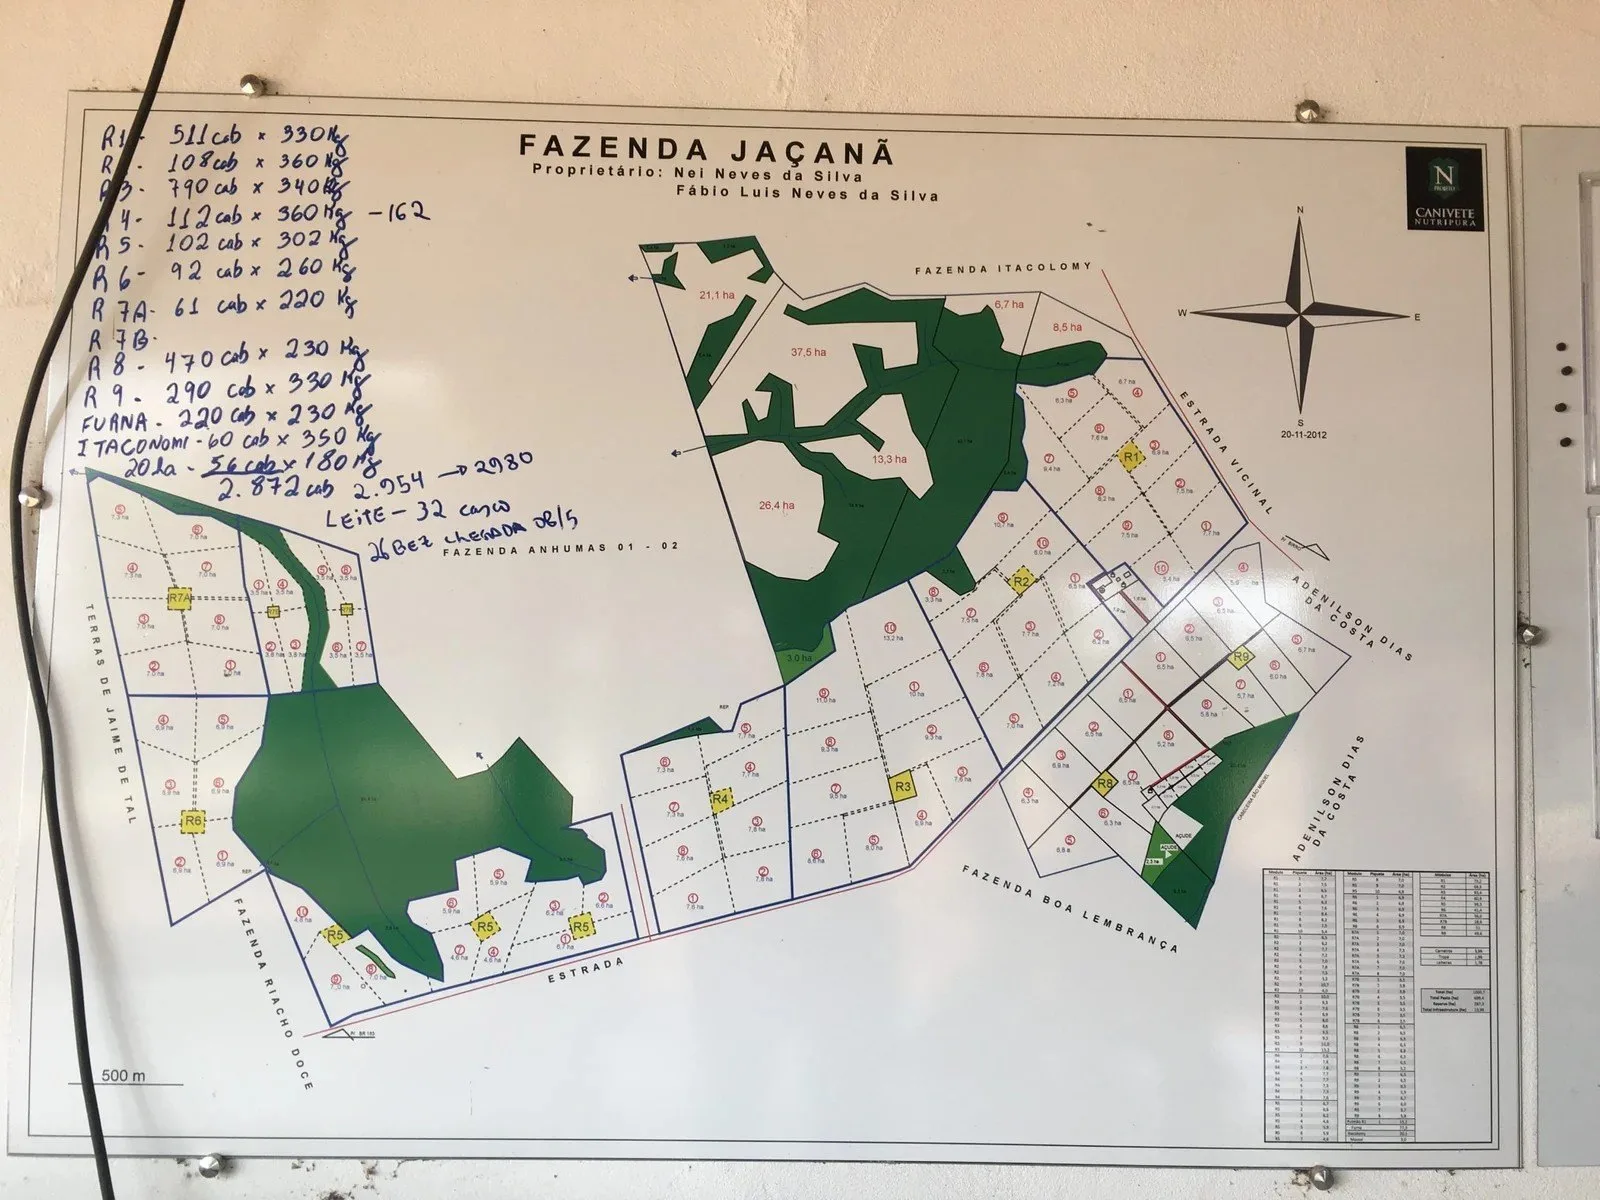
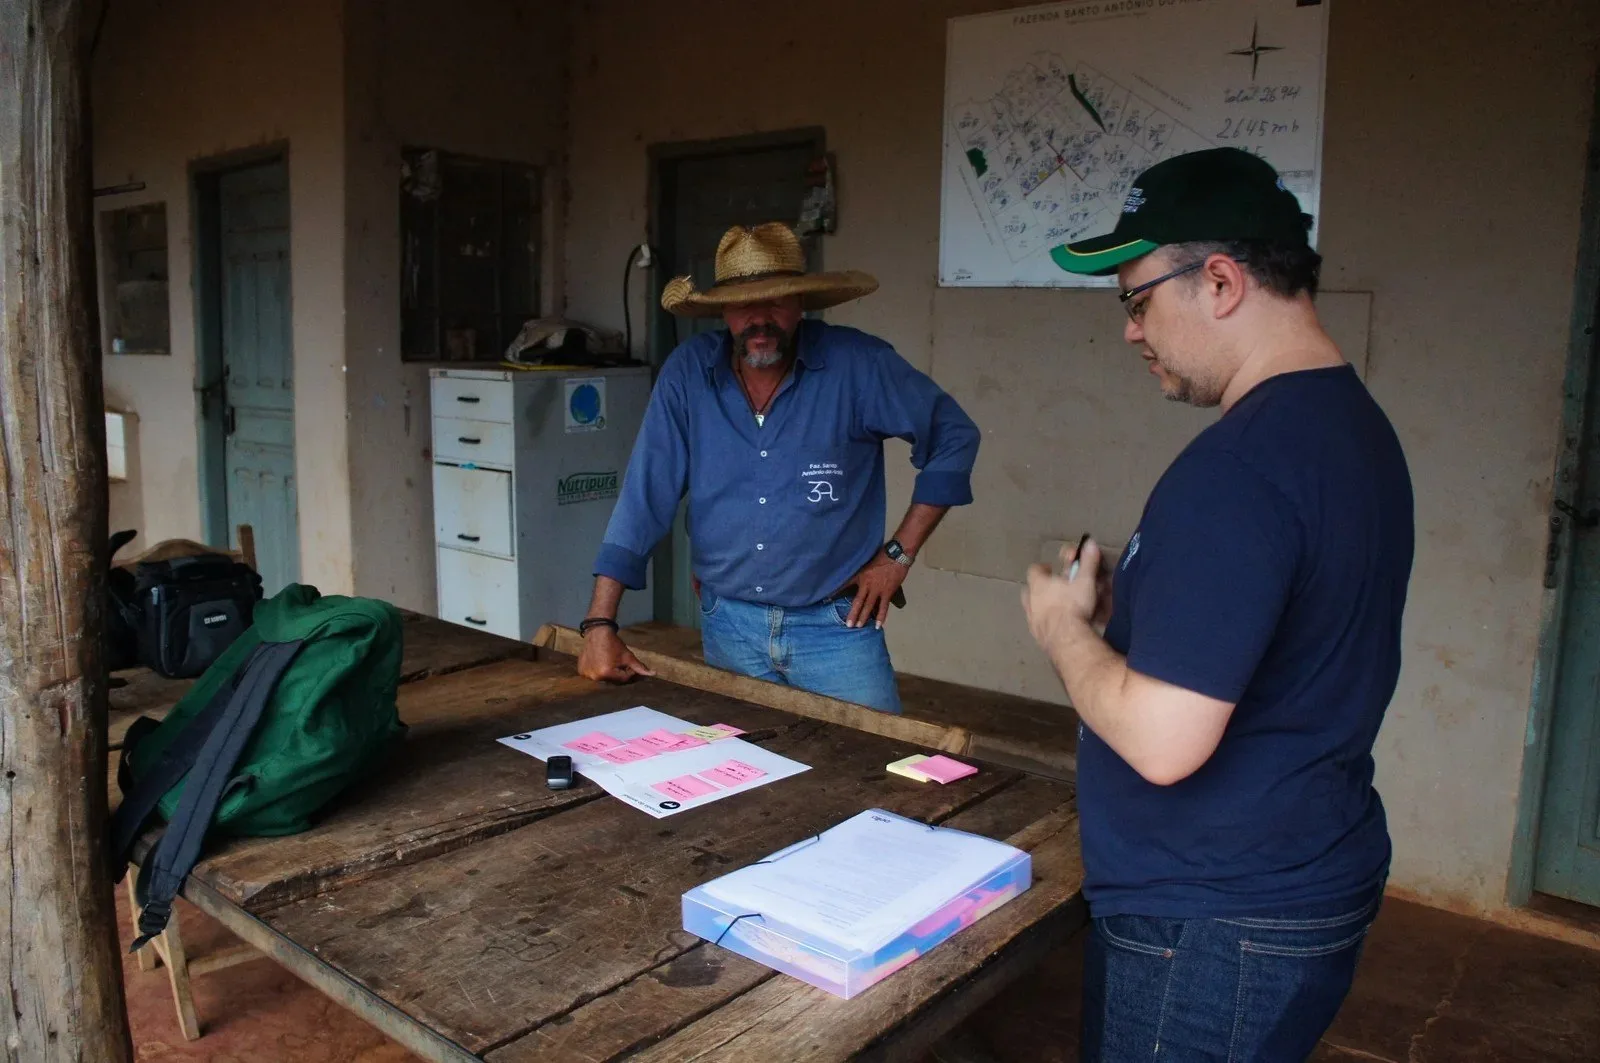
I followed the routine of wide-pasture farms: the paddocks, the rotation, the water point where the herd gathers, and the ranch hands riding out on horseback to check on the cattle. Shadowing and in-depth interviews with ranchers and farm staff captured how the herd is actually tracked.
Steps 01 and 02 are what changed the project: what the business hypothesis called a pain point, the field showed was not one.
 1 / 4
Shadowing with ranchers and farm staff
On-site observation of the routine on extensive-pasture farms: how the herd moves between paddocks, how ranch hands check on the cattle, how weight is measured in the chute and where the whole herd passes every day. In-depth interviews captured the why behind each decision.
Mapping how the herd is tracked
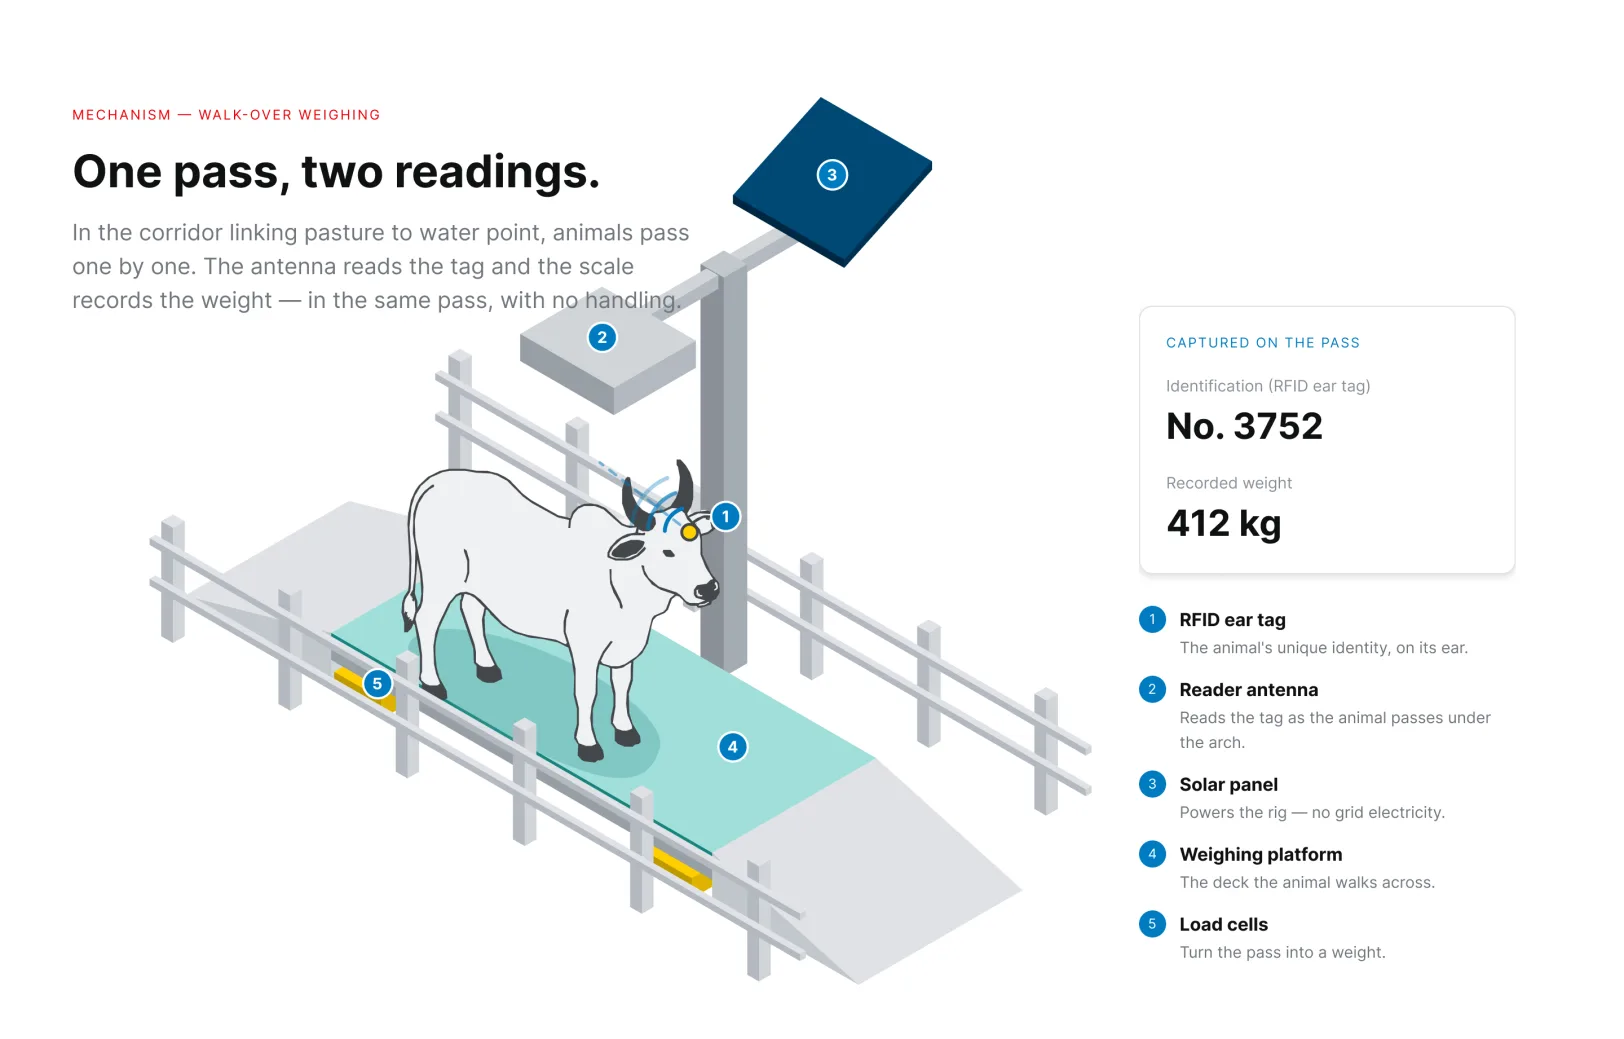
Extensive ranching runs on its own logic: paddocks, rotation and a single point every animal walks through — the corridor linking pasture to water point. Every animal has to drink, so that corridor became the key to the solution.
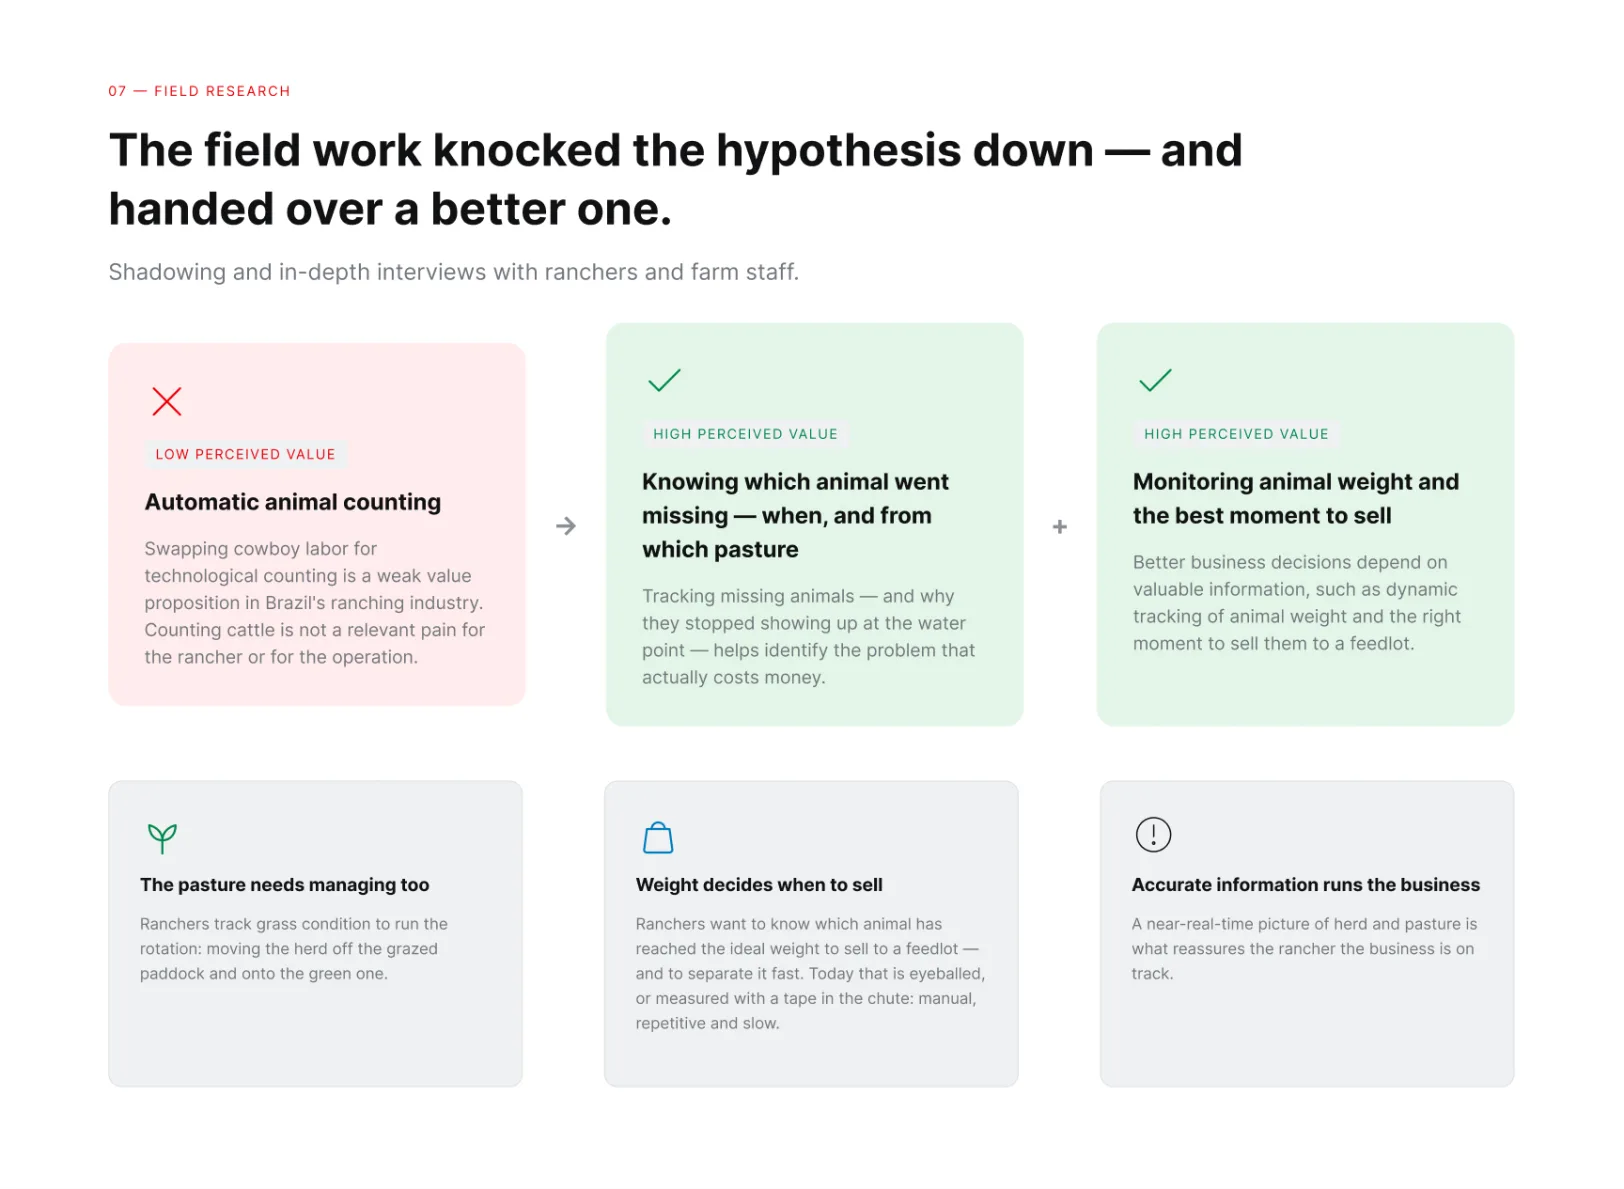
The field work knocked the hypothesis down — and handed over a better one.
Ranch hands are low-cost labor in Brazil, so swapping them for automatic counting is a weak value proposition. What costs money is an animal that goes missing — sick, dead or stolen — and stays invisible for days.
Ranchers are risk-averse. They don't buy labor reduction — they buy predictability over an asset that roams loose in the pasture.
Learnings from Field Work
- Counting cattle is not a relevant pain for the rancher.
- Ranch hands are low-cost labor — automation doesn't pay for itself by cutting staff.
- An animal is only seen when someone rides out to look.
- Missing animals stay invisible for days — sickness, death or theft.
- What matters is which animal went missing, when and from which pasture.
- Every animal has to drink: the water point gathers the whole herd.
- The corridor to the water point is the one place the herd passes one by one.
- Rotation is decided by eye, based on grass condition.
- Tracking pasture condition sets the right moment to rotate.
- Weight decides when to sell to a feedlot.
- Weight is measured with a tape in the chute: manual, repetitive and slow.
- Ranchers want to separate animals that reached the ideal weight — fast.
- Accurate information is what reassures the rancher the business is on track.
- Ranchers are risk-averse: they buy predictability, not labor reduction.
- There is no grid electricity in the field: hardware has to run on solar power.
- The same feedlot hardware can work — in a different place.
Learnings summary
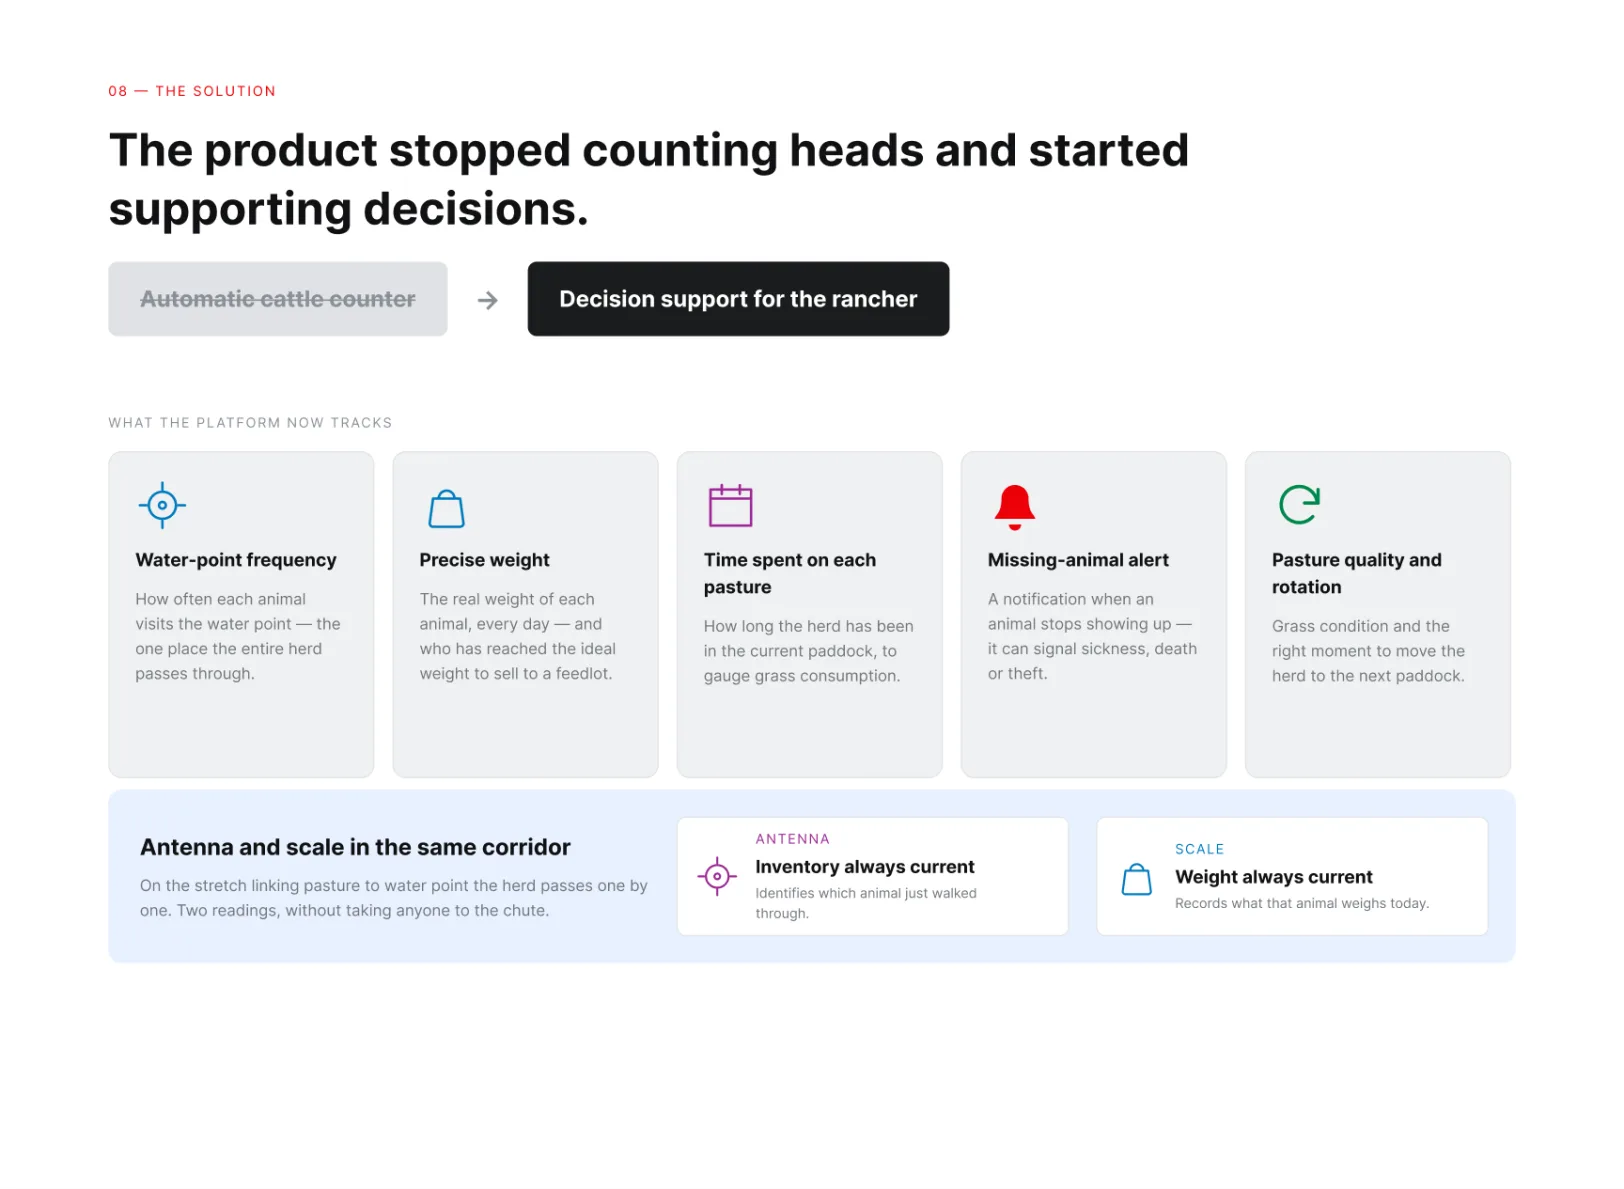
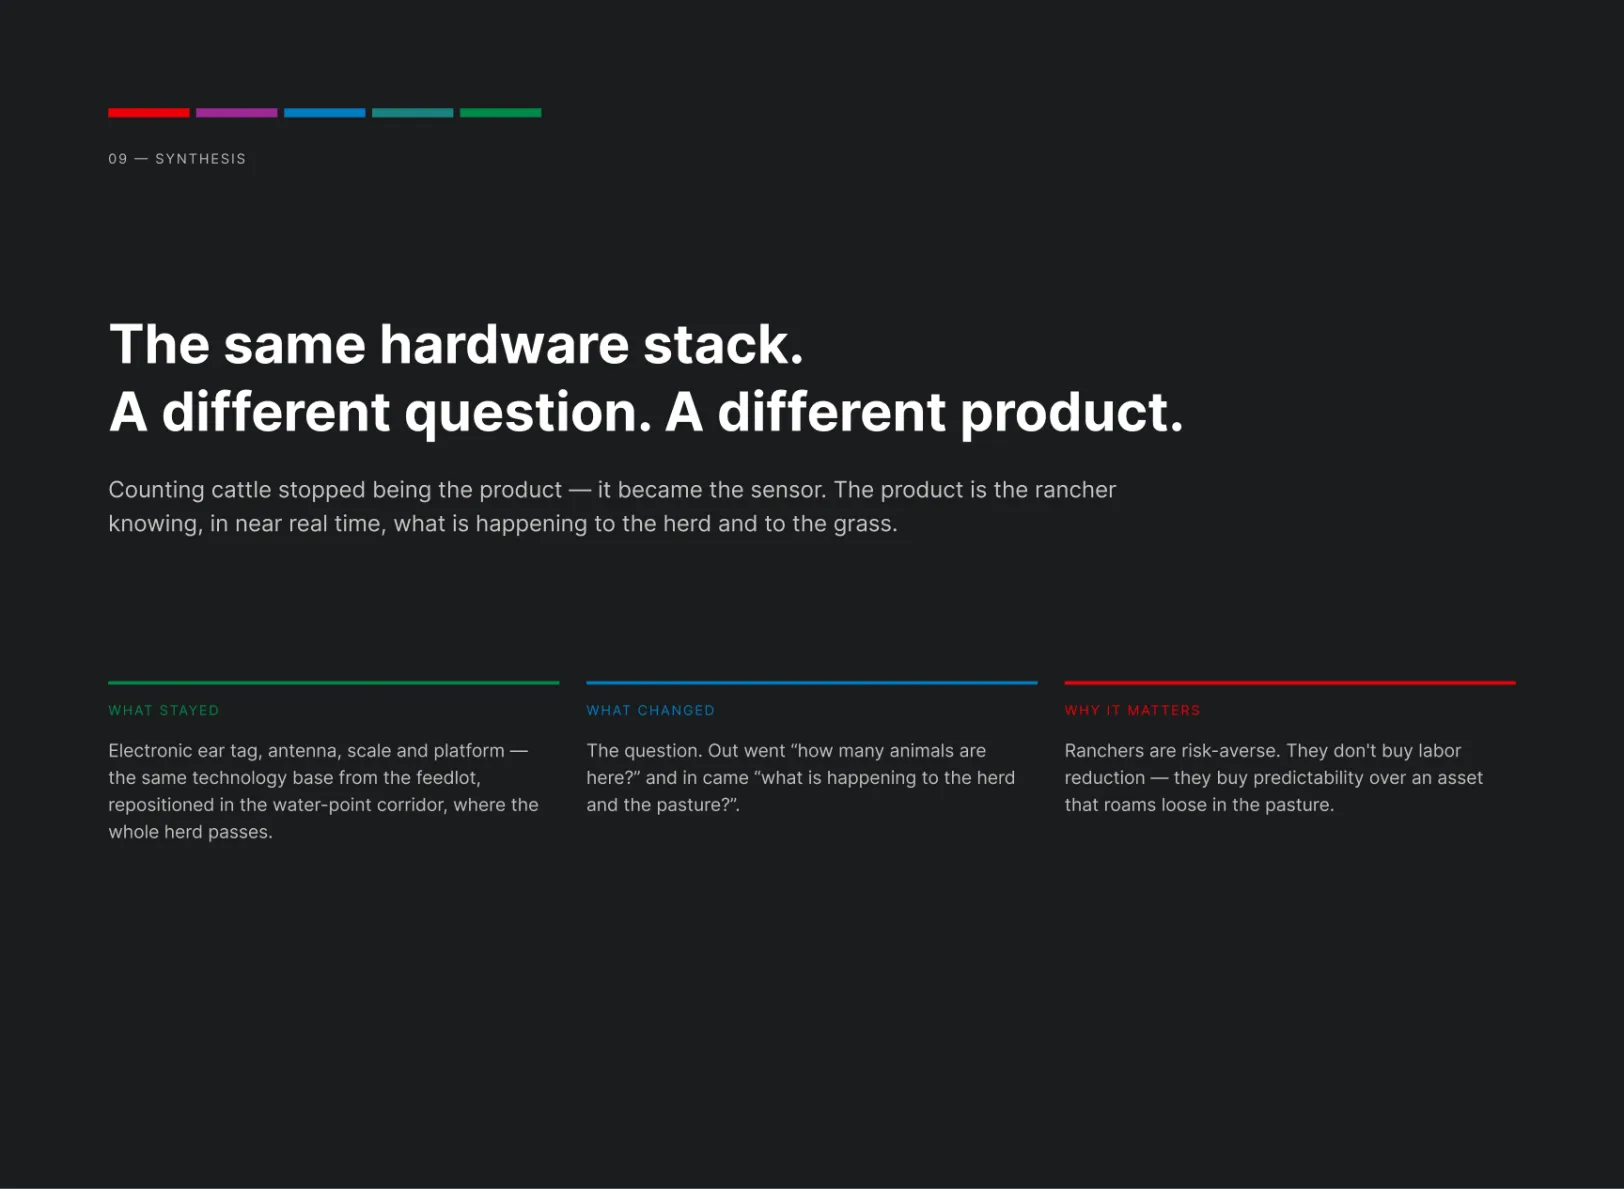
The product stopped counting heads and started supporting decisions. Counting became the sensor: the value is the rancher knowing, in near real time, what is happening to the herd and to the grass.
Phase 2 — Synthesis and co-creation
Organizing what the field showed separated real pain from assumed pain. Three fronts emerged: knowing which animal went missing — when and from which pasture; monitoring weight to find the best moment to sell; and managing pasture condition to run the rotation.
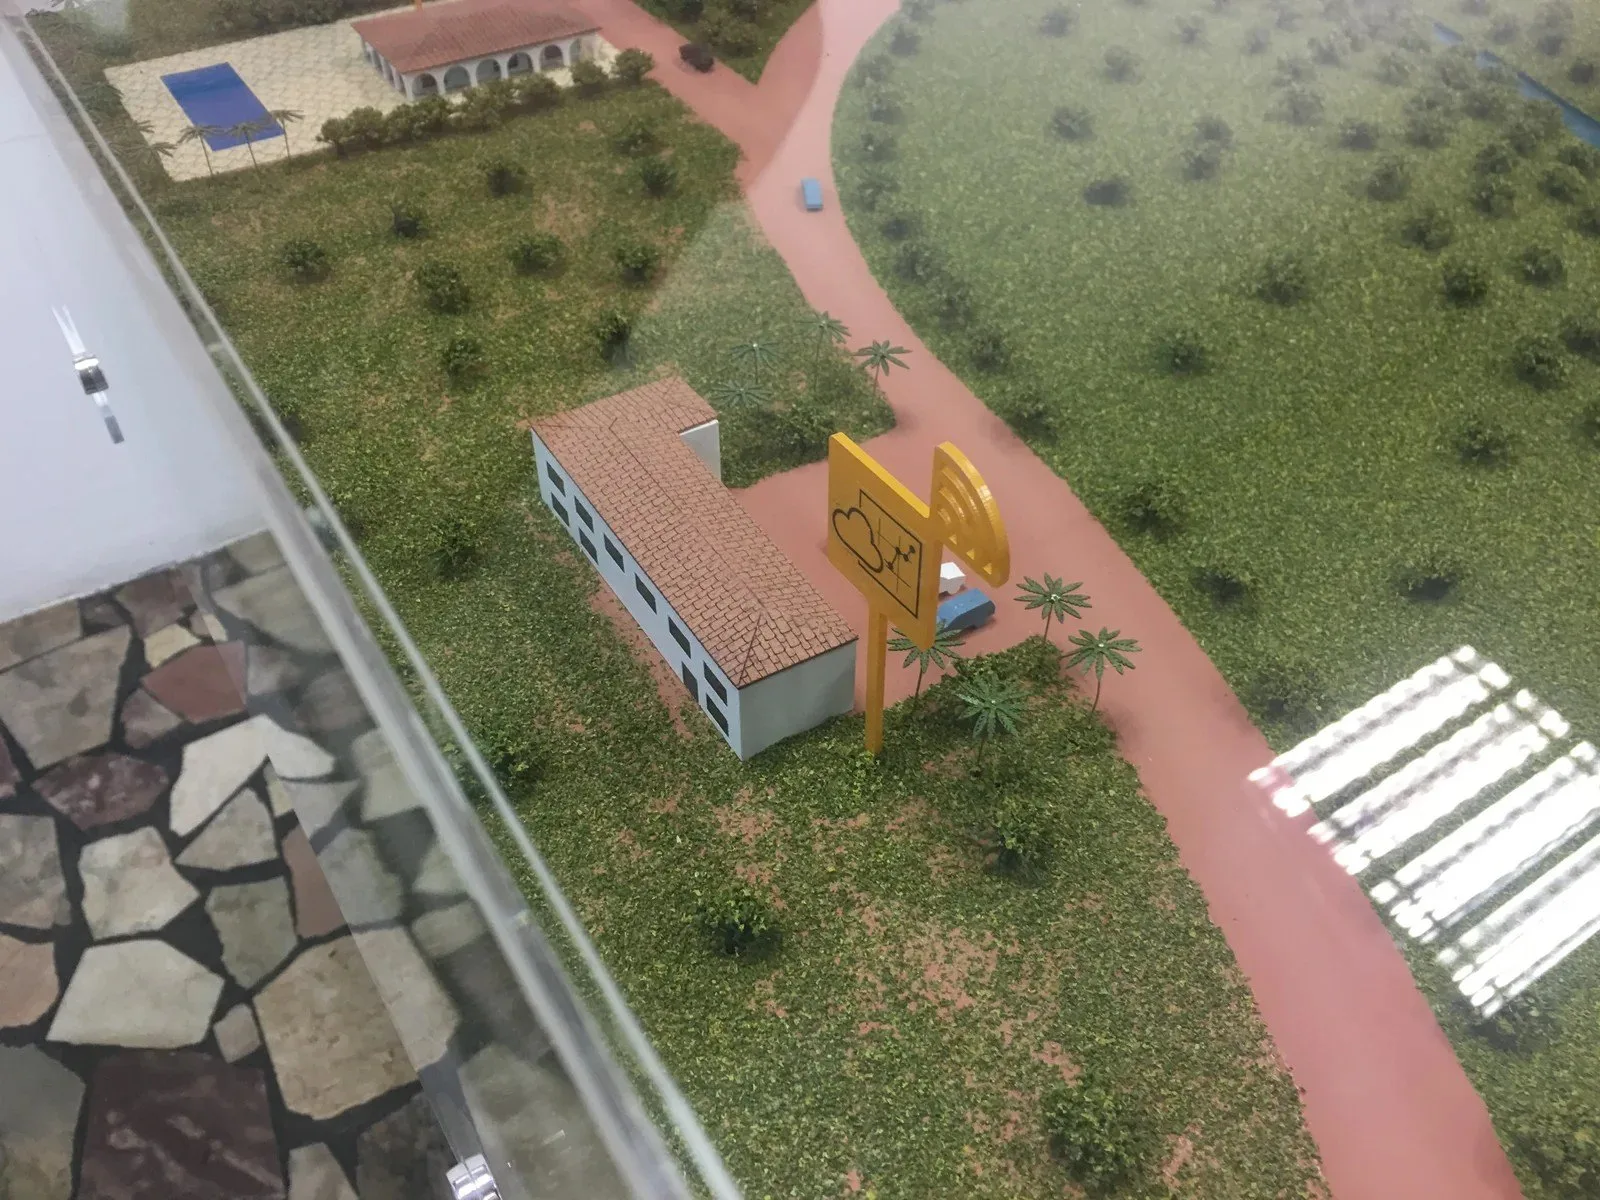
I drew the first solution hypotheses together with ranchers, farm staff and Bosch stakeholders. The key decision was to keep the same hardware stack — RFID ear tag, antenna, scale and platform — and reposition it in the water-point corridor, where the whole herd passes one by one, powered by solar energy and with no extra handling.
Then the screens were turned into a navigable prototype so they could actually be tested.
 1 / 4
Co-creation sessions with ranchers and Bosch specialists
With the findings organized, we co-created solutions with ranchers, farm staff and Bosch's product and engineering teams. Together we prioritized missing-animal alerts, daily weight and pasture rotation — and sketched the flows that became the first prototypes.
The prototype was built on top of the visual base of Bosch's feedlot platform and adapted for the extensive context. At the end of the prototyping process, we took it back to the farms for testing with ranchers and ranch hands.
Phase 3 — Design cycles and field validation
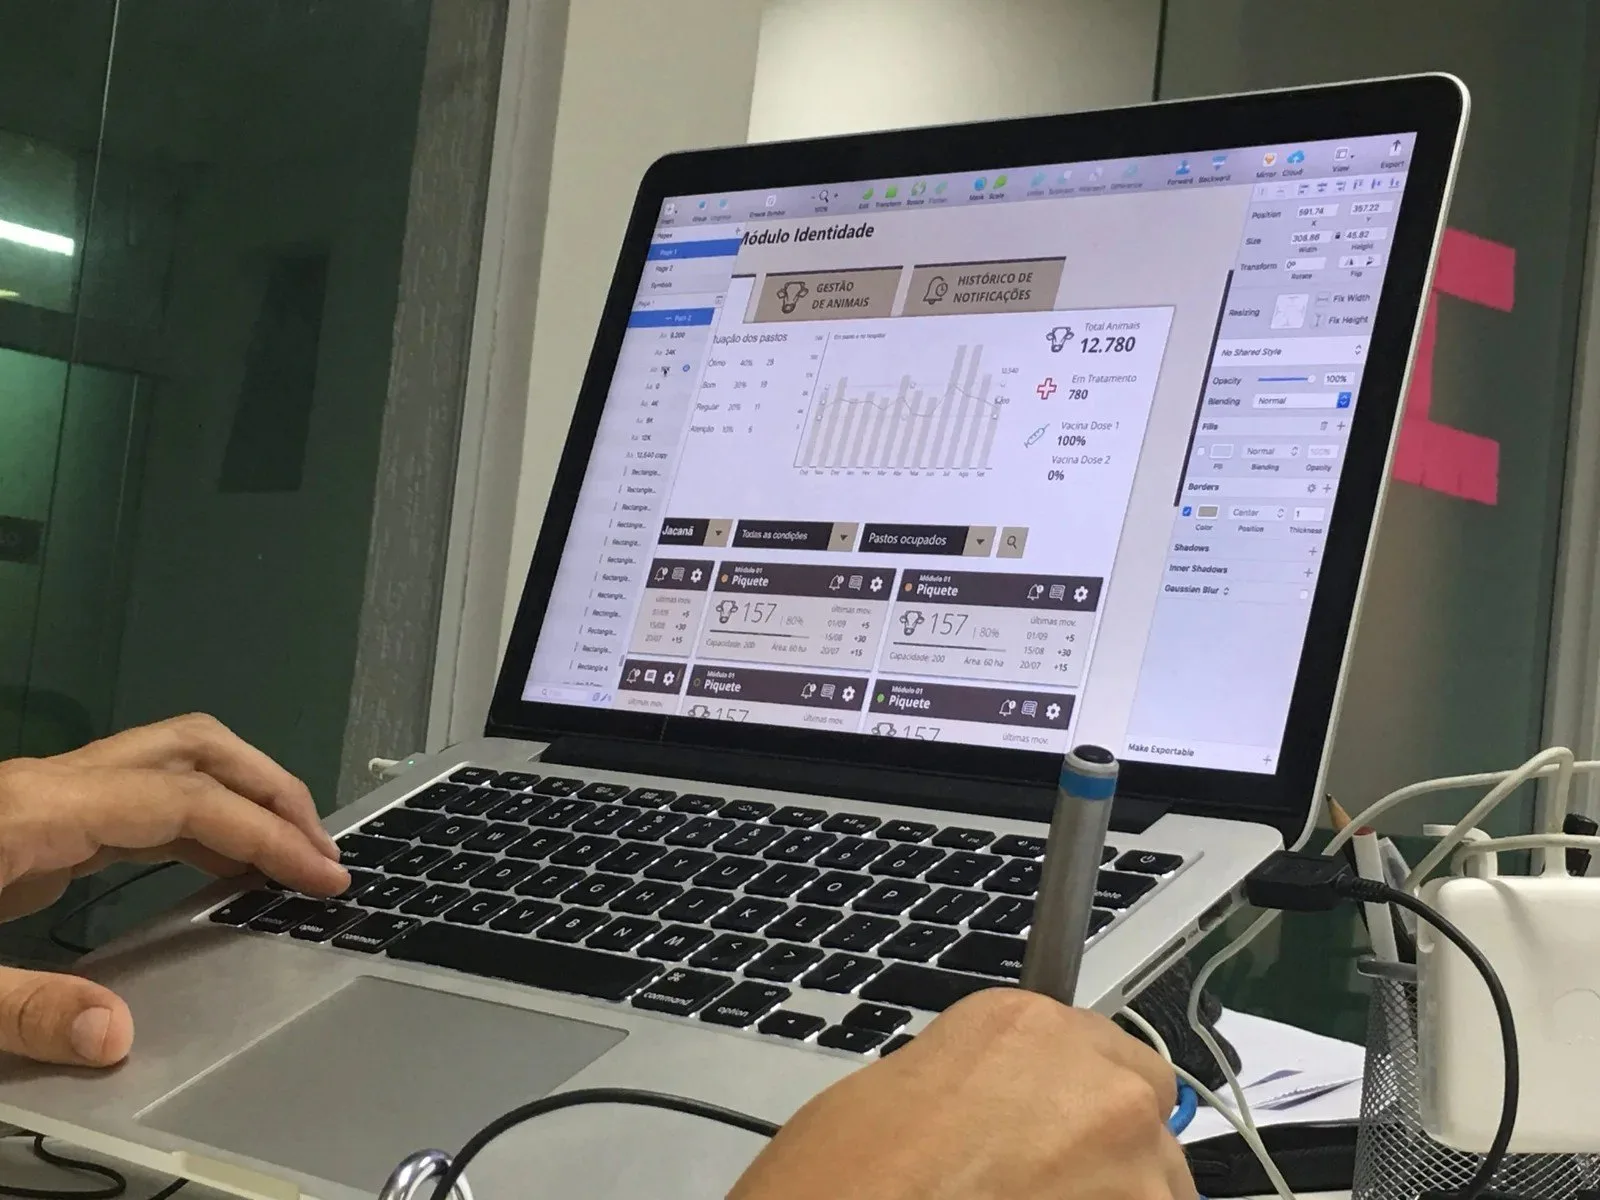
Working in cycles with Bosch's product team: prototyping, detailing the interface and testing with ranchers and farm staff in the field — to validate the paddock, animal and alert flows before finalizing the interface.
 1 / 5
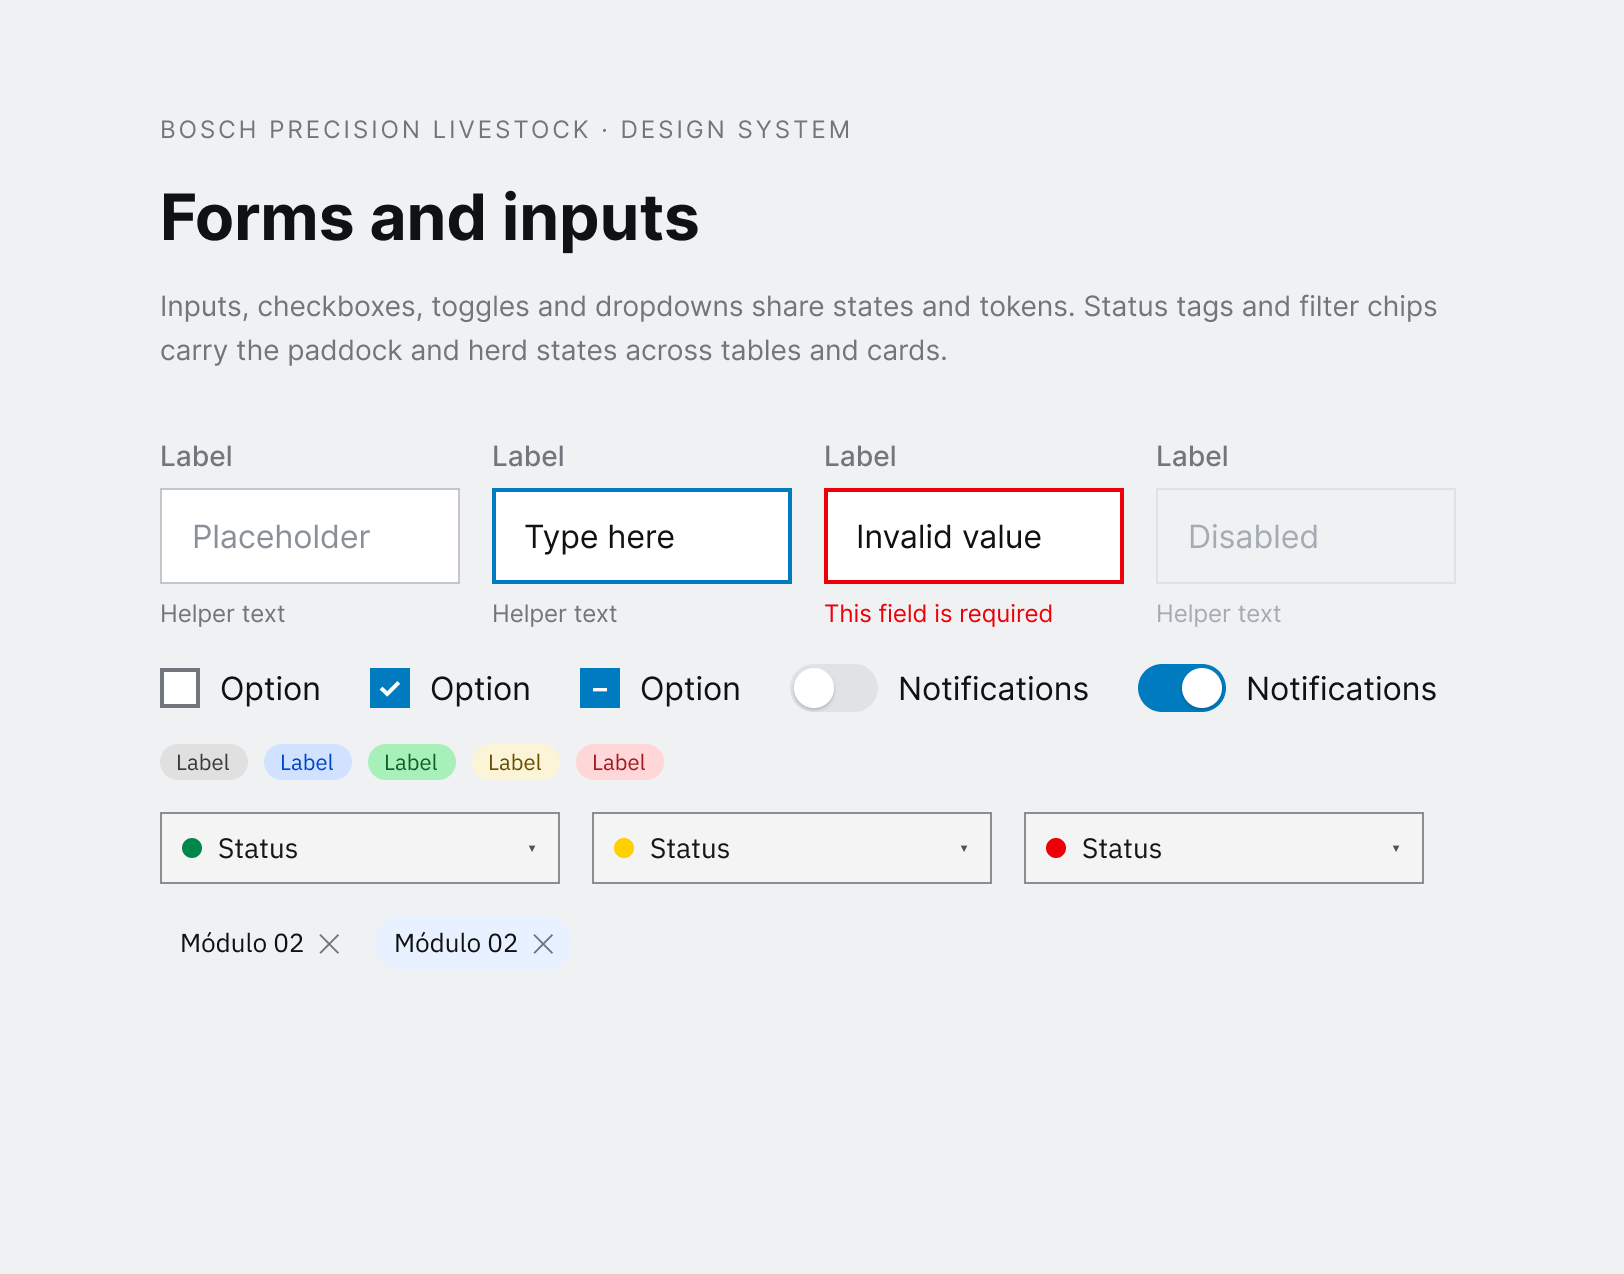
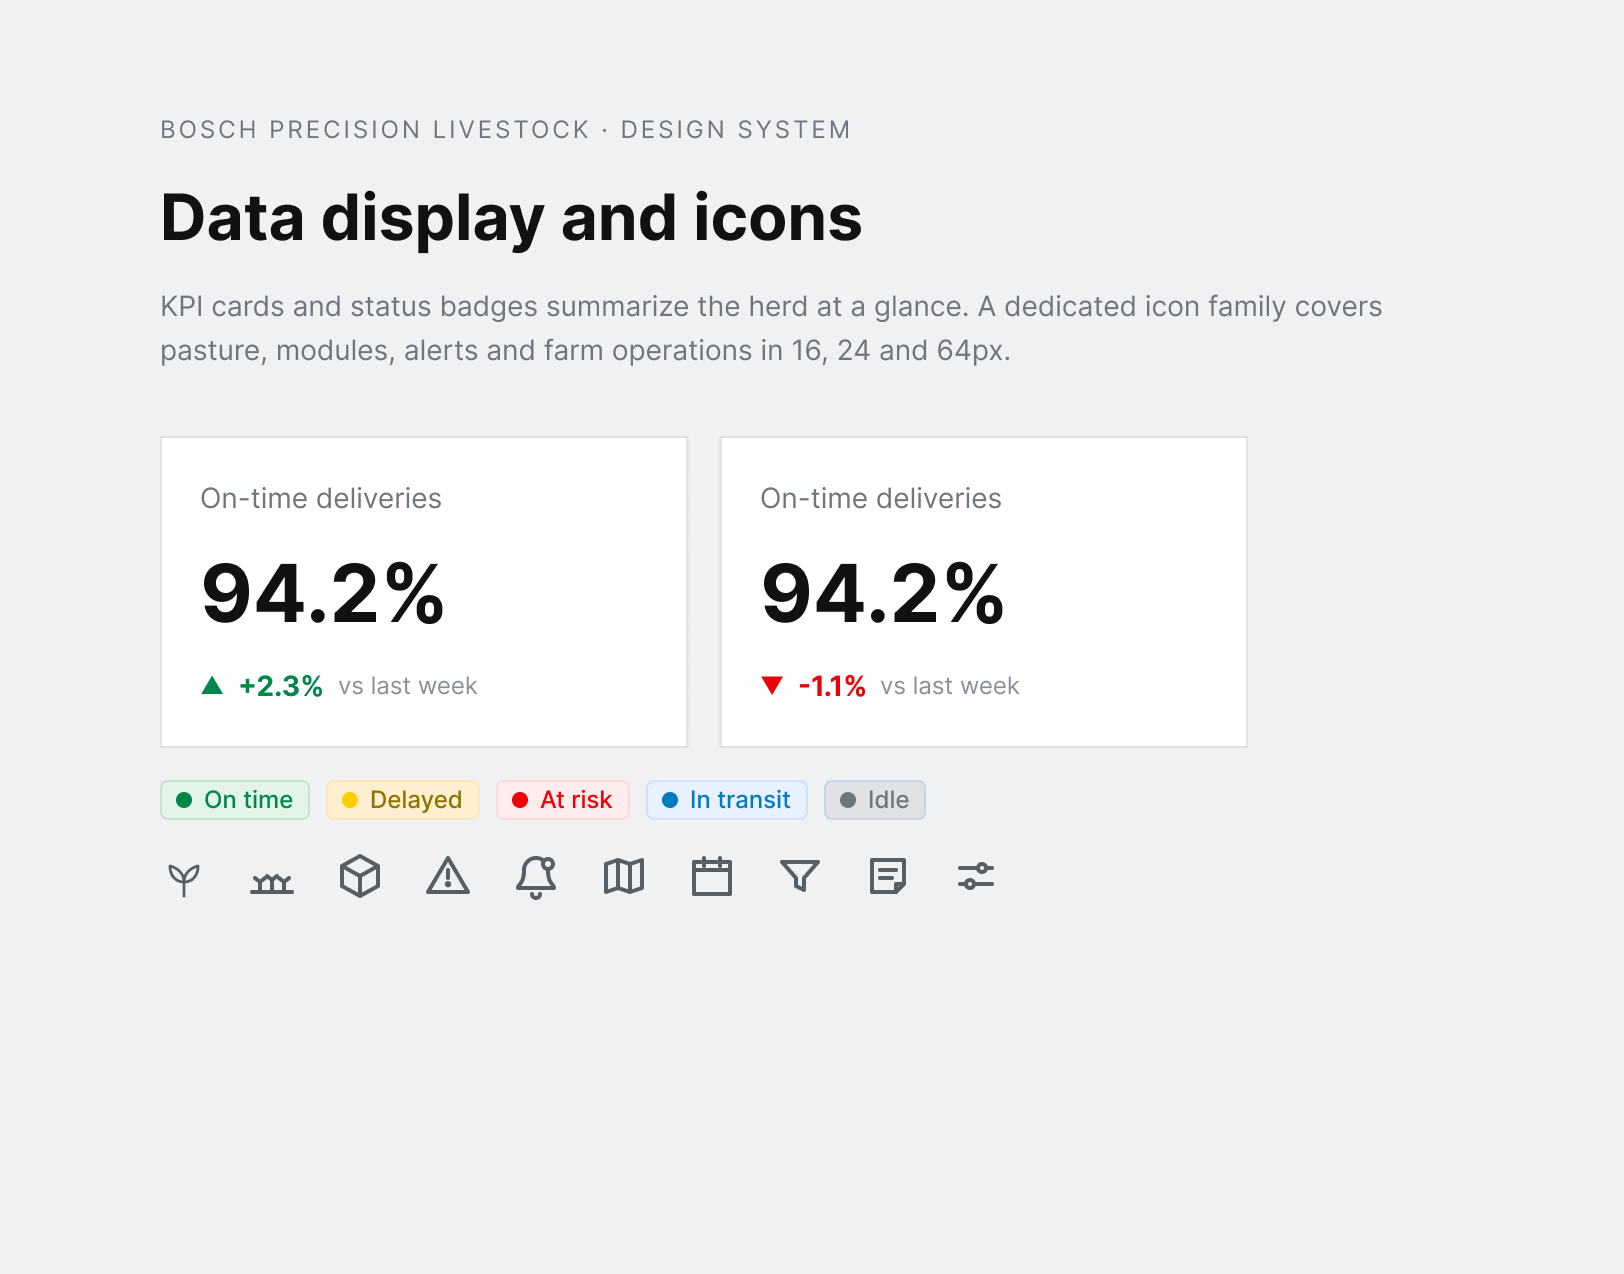
Design System
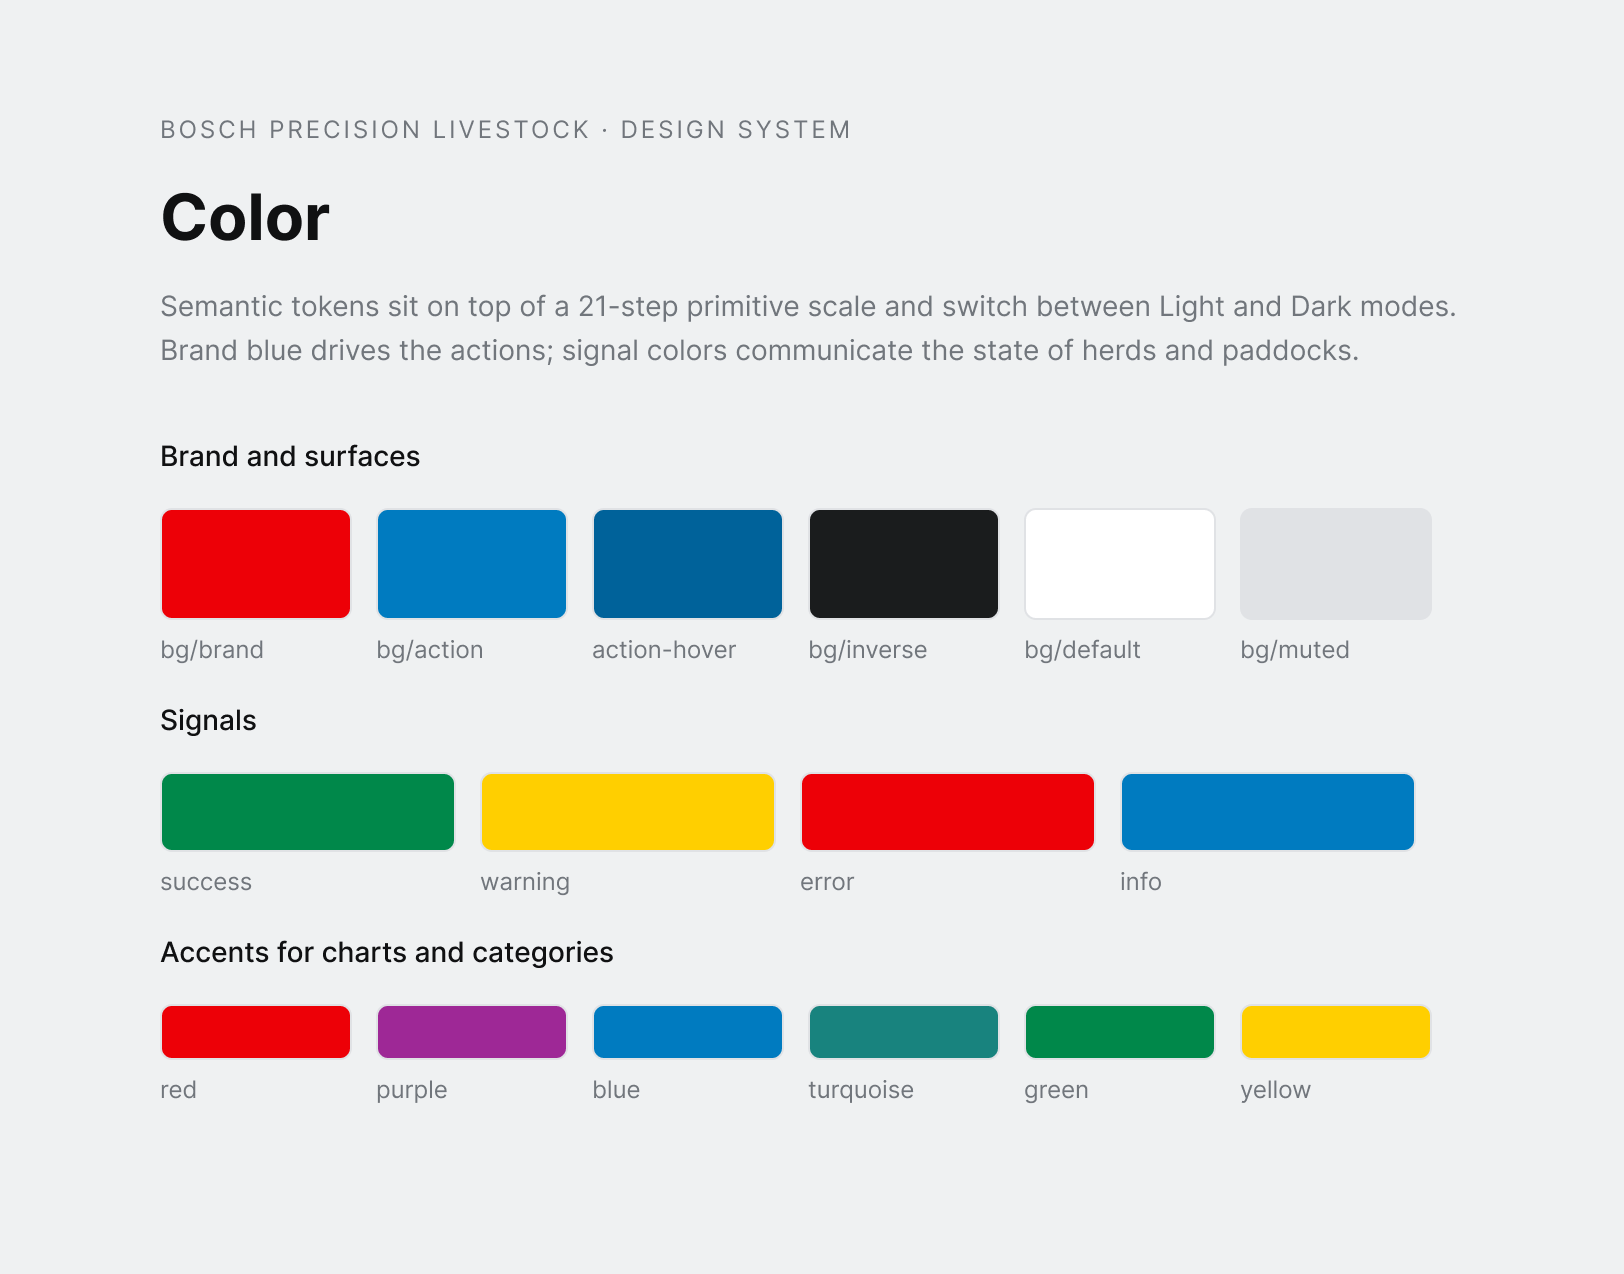
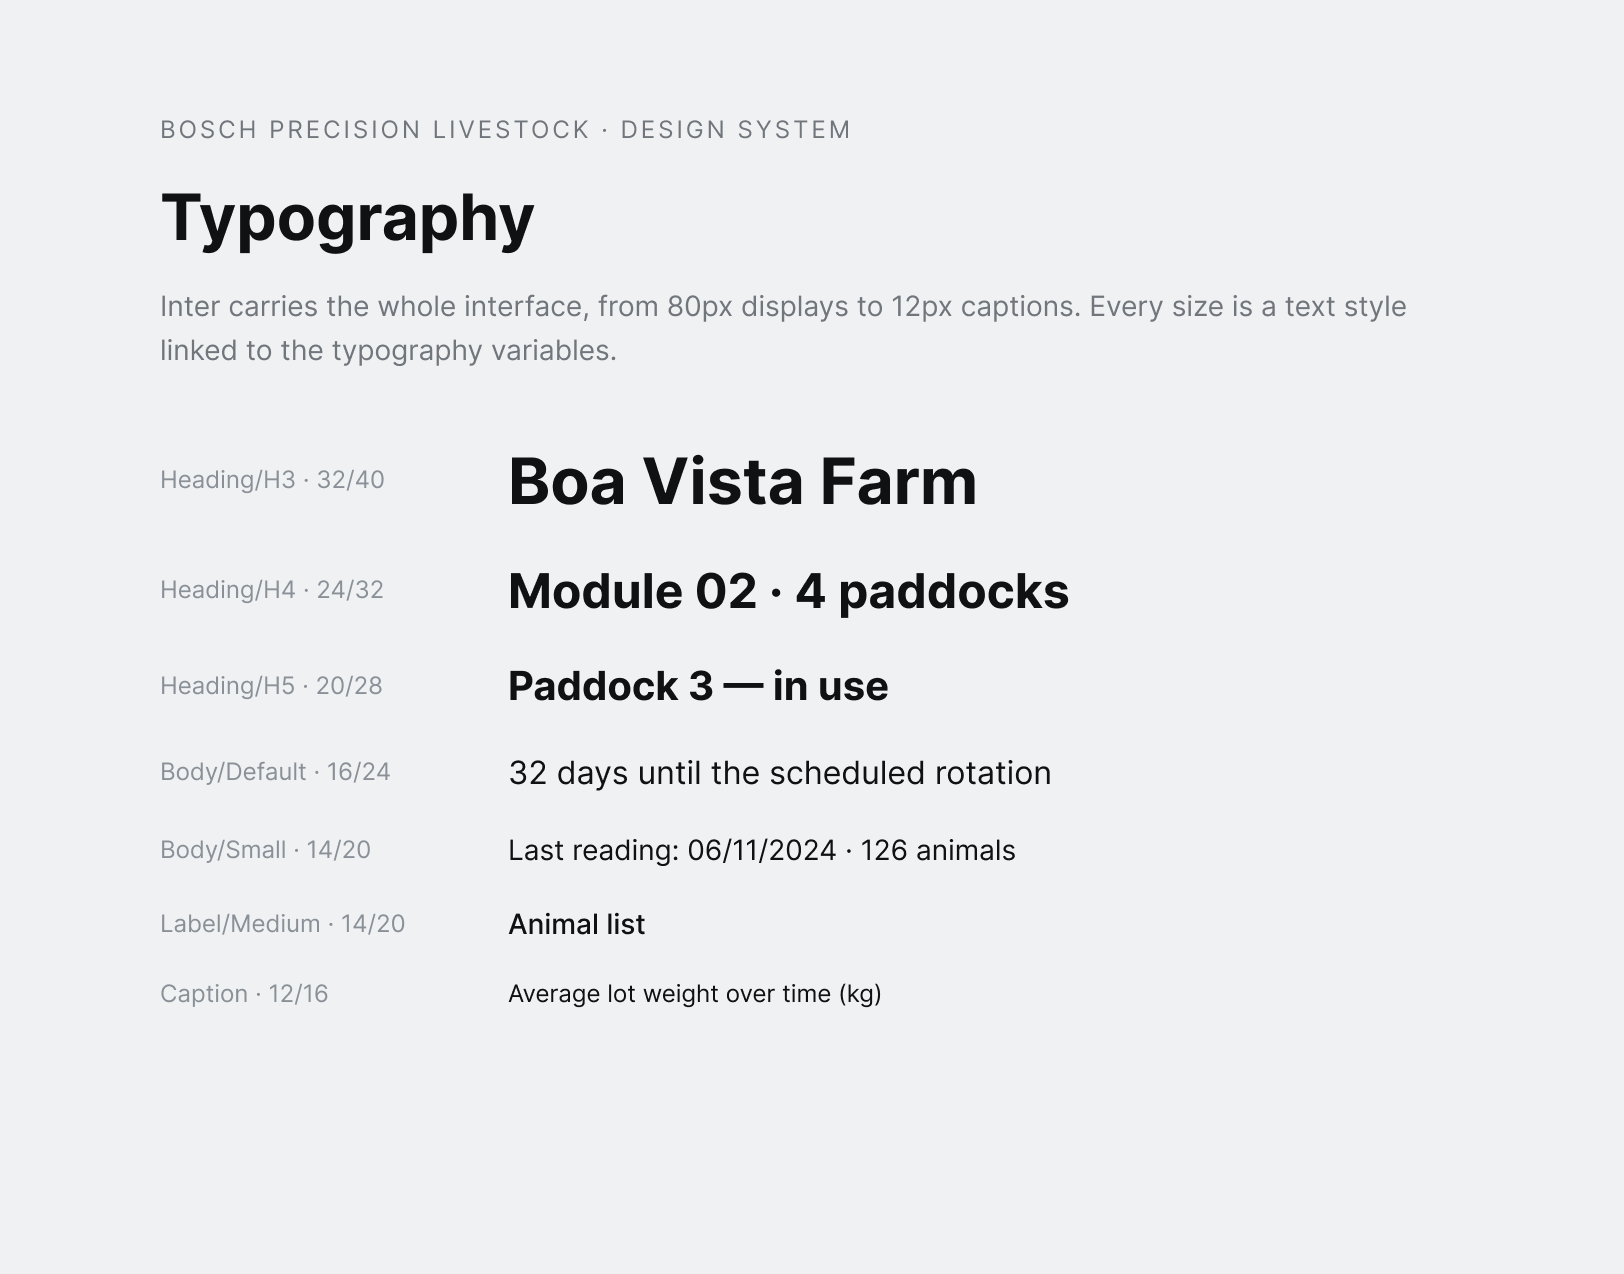
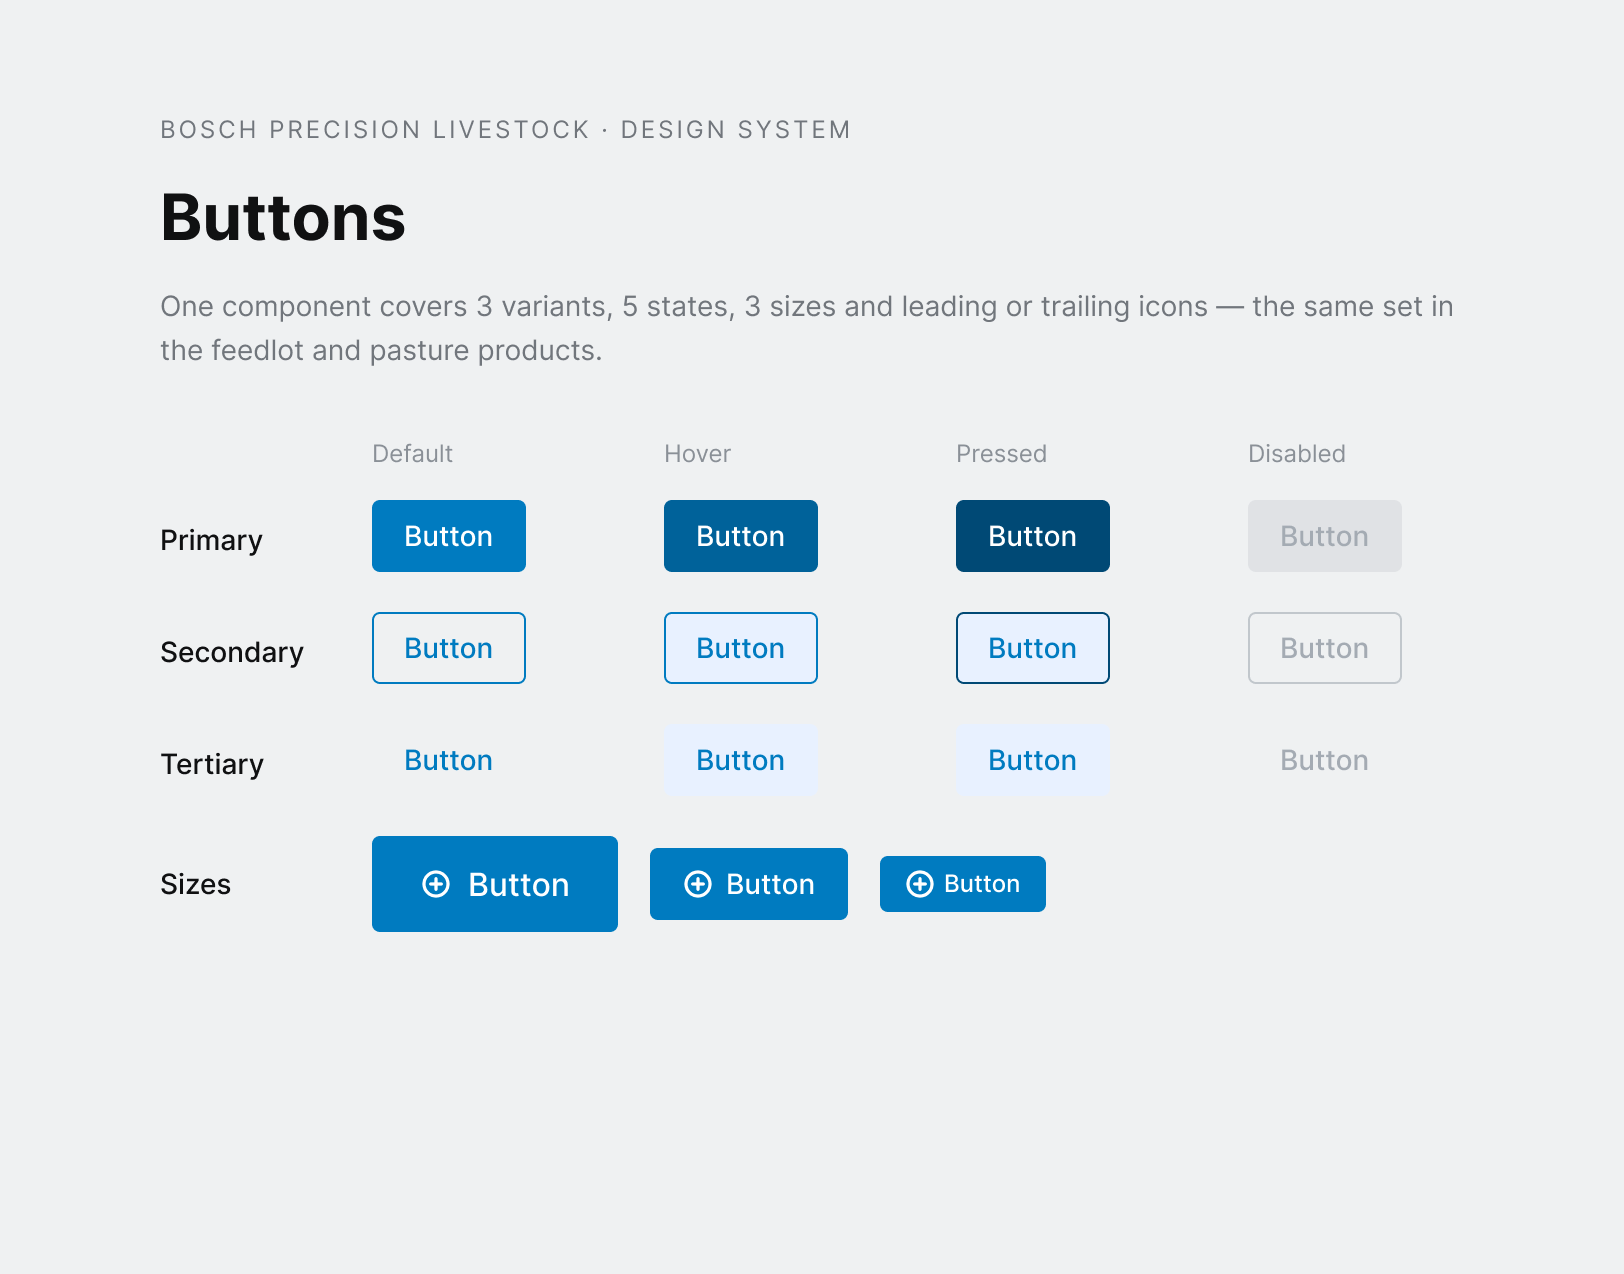
To keep the feedlot and pasture products consistent, the interface was built on a shared design system: color and typography foundations, buttons, forms, data display, navigation, charts and a livestock icon set — reused across both platforms.
UI Design
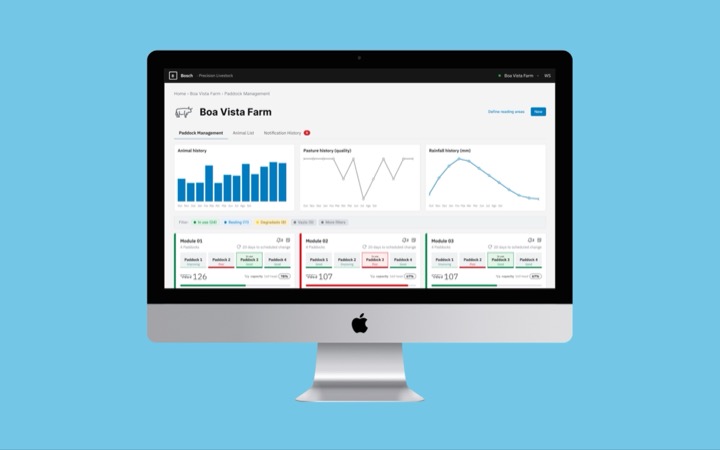
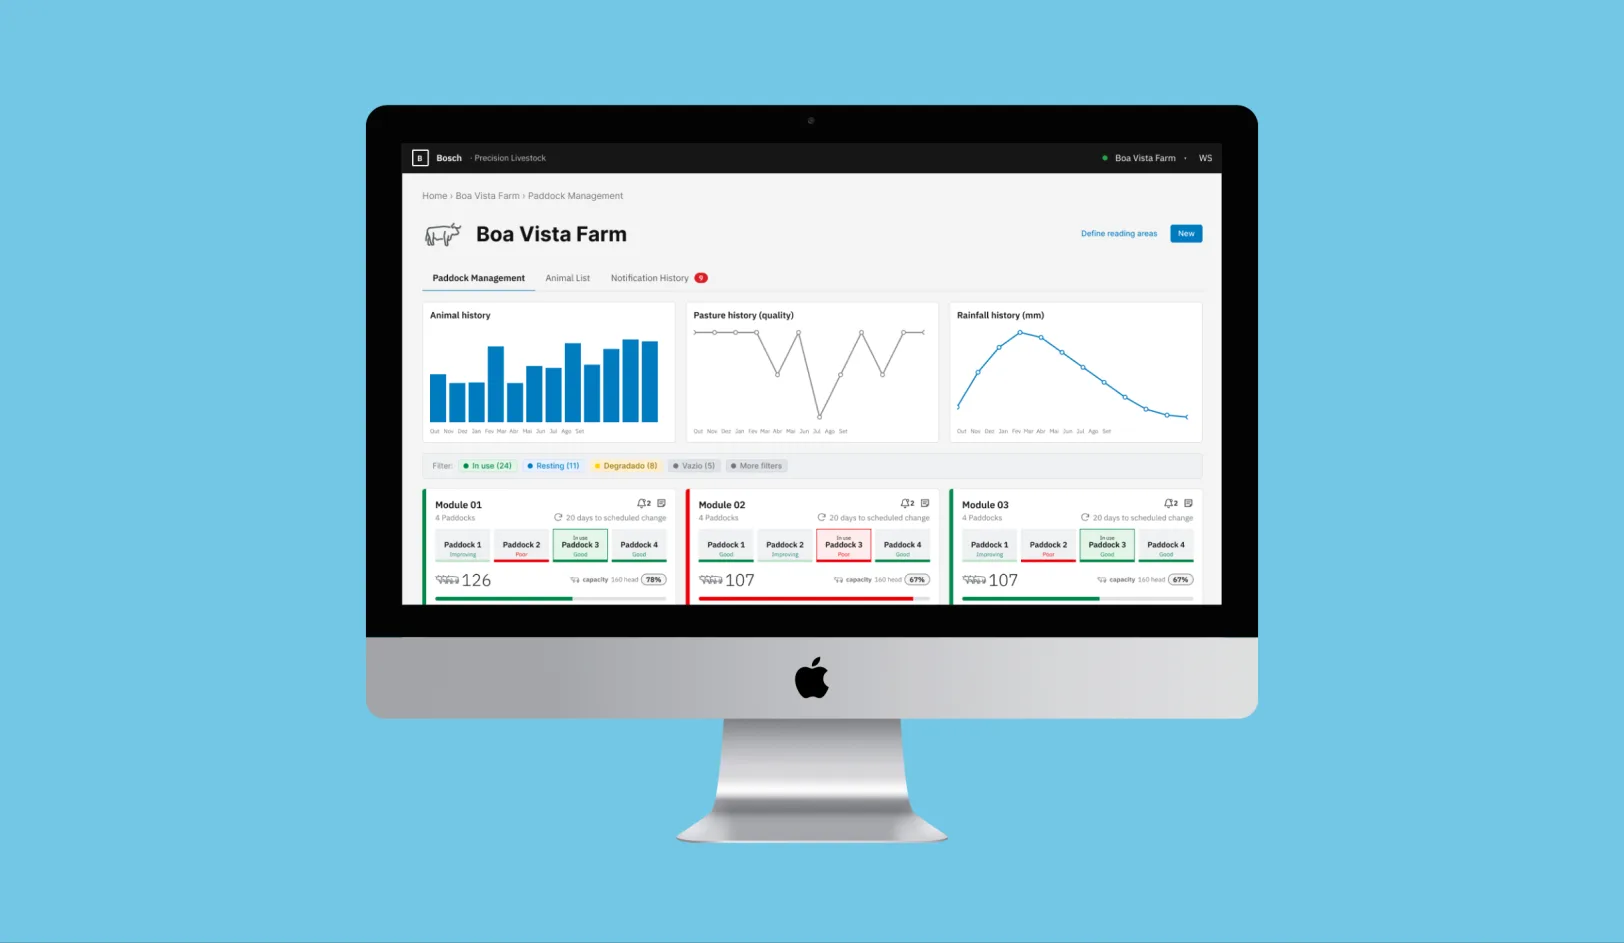
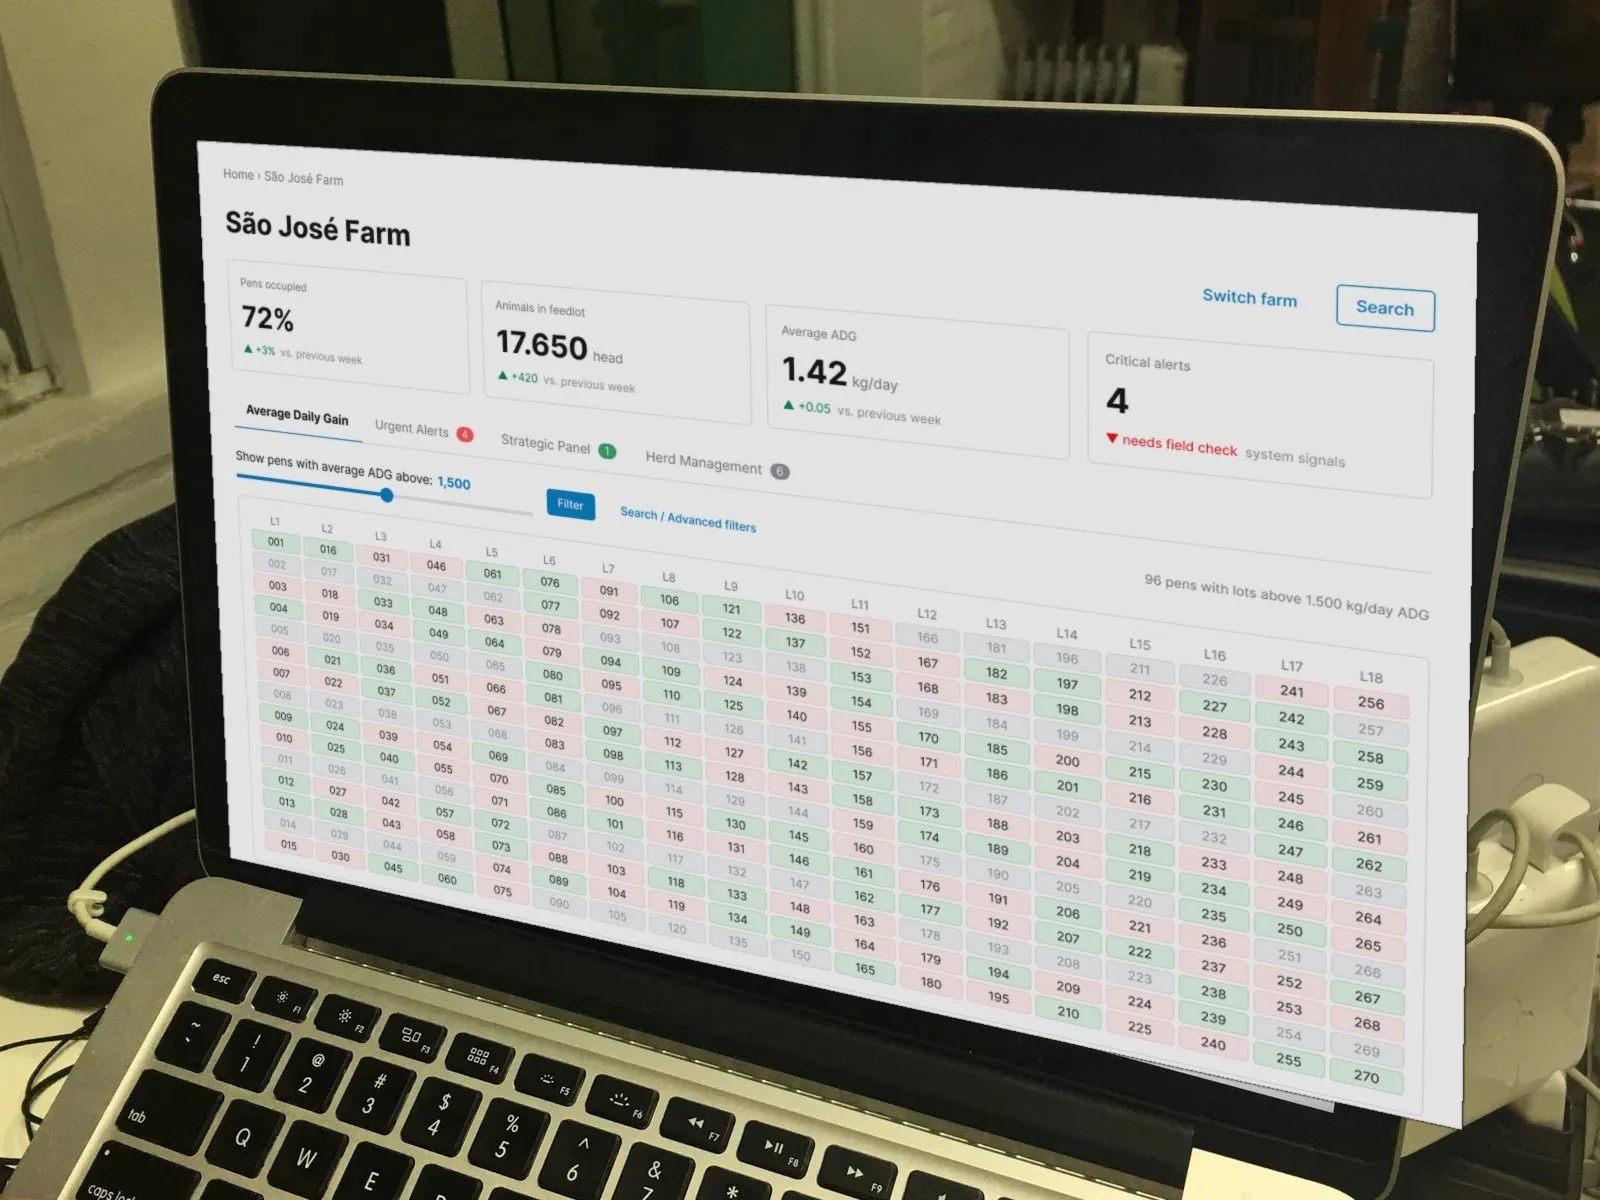
The high-fidelity screens cover both products: the feedlot view with average daily gain, urgent alerts, lot and animal records; and the pasture view with the paddock dashboard, rotation, pasture quality, animal list and notification history.
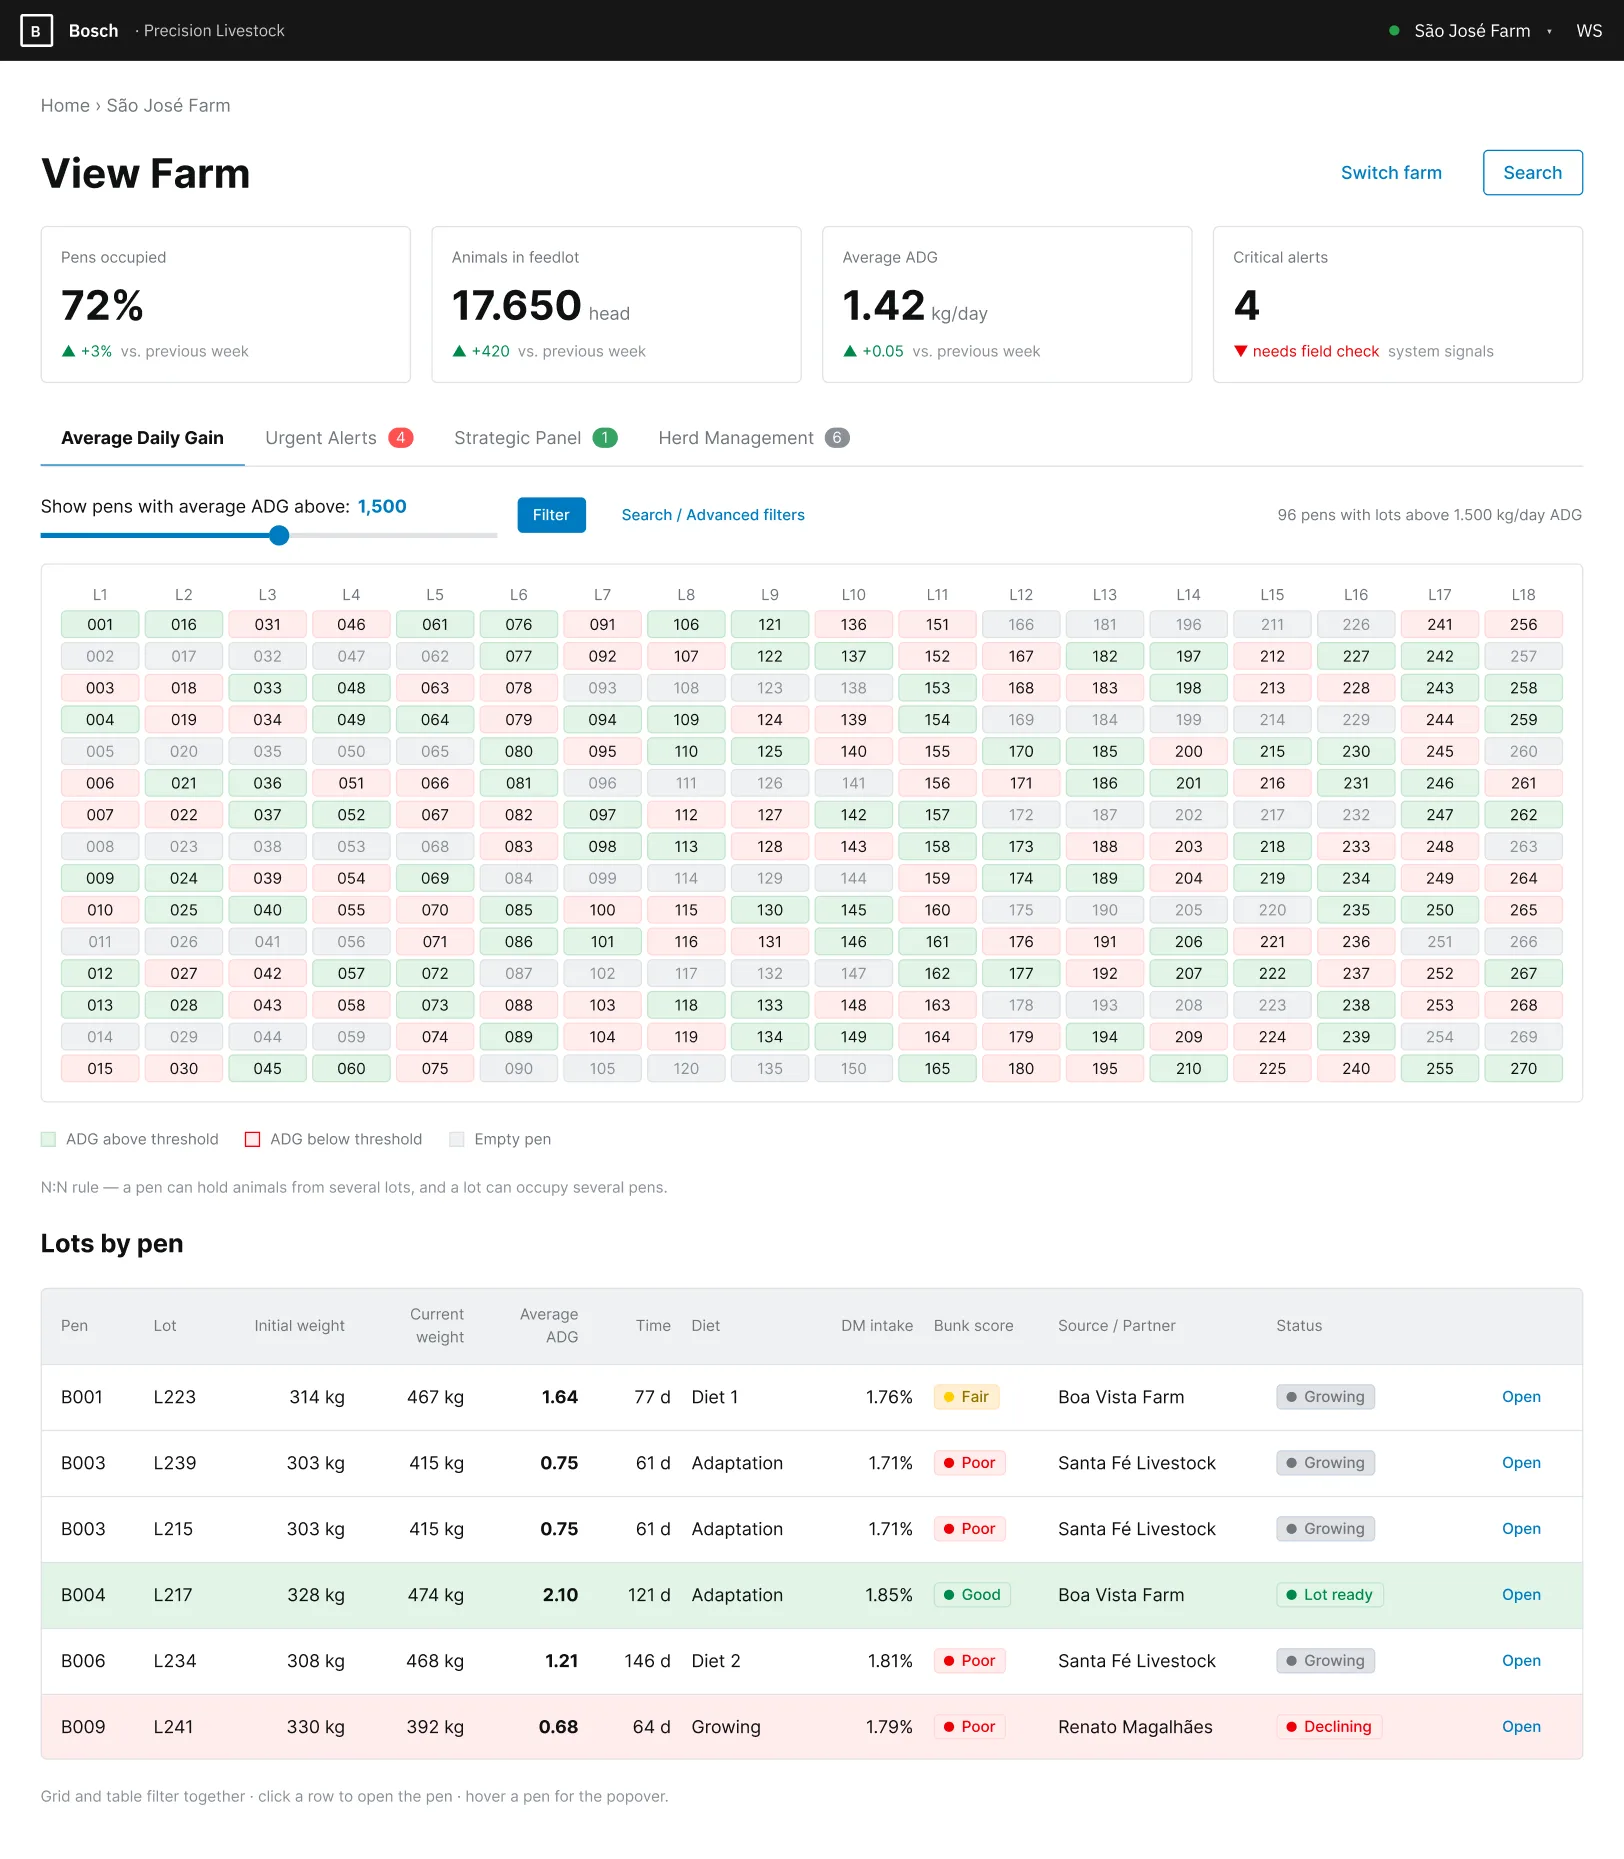
1.0 · VIEW FARM — AVERAGE DAILY GAIN
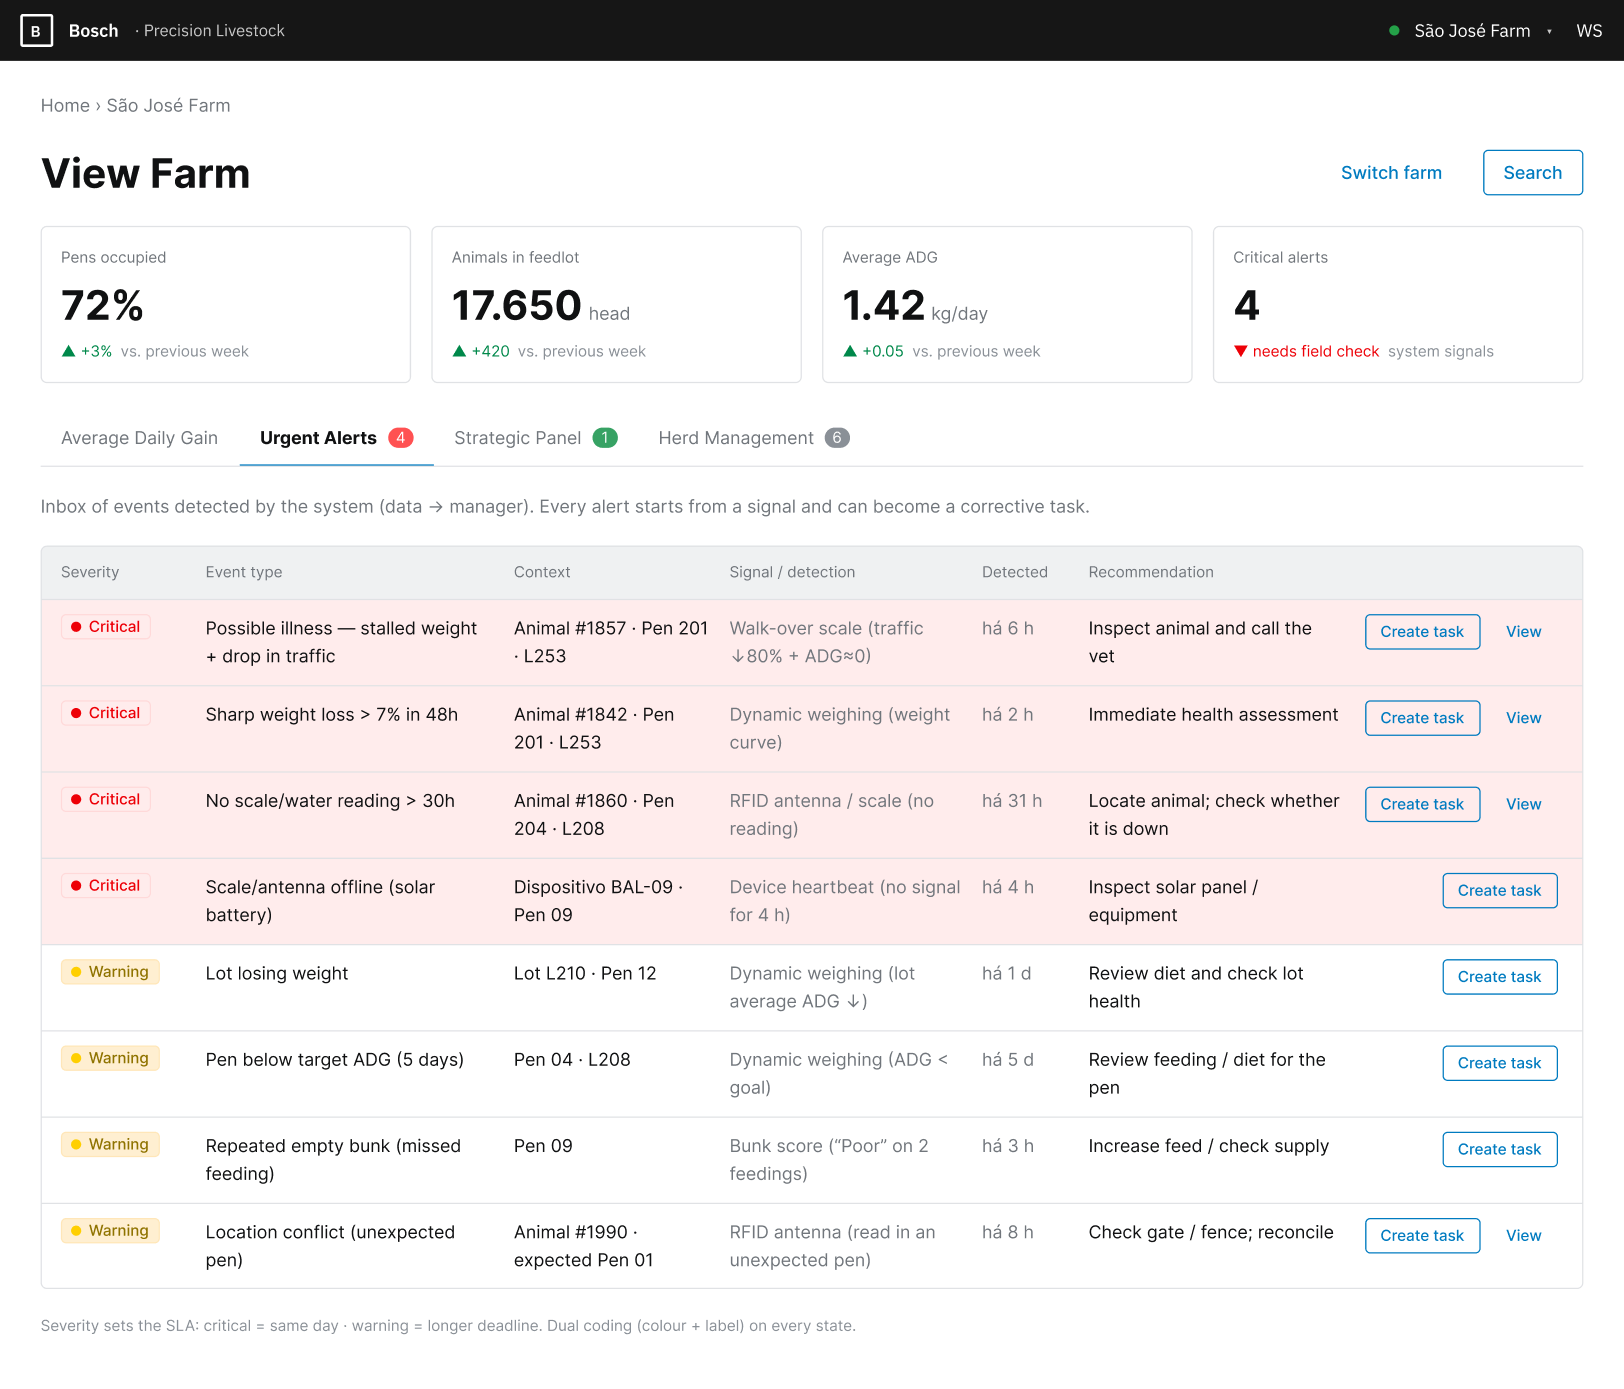
1.1 · VIEW FARM — URGENT ALERTS
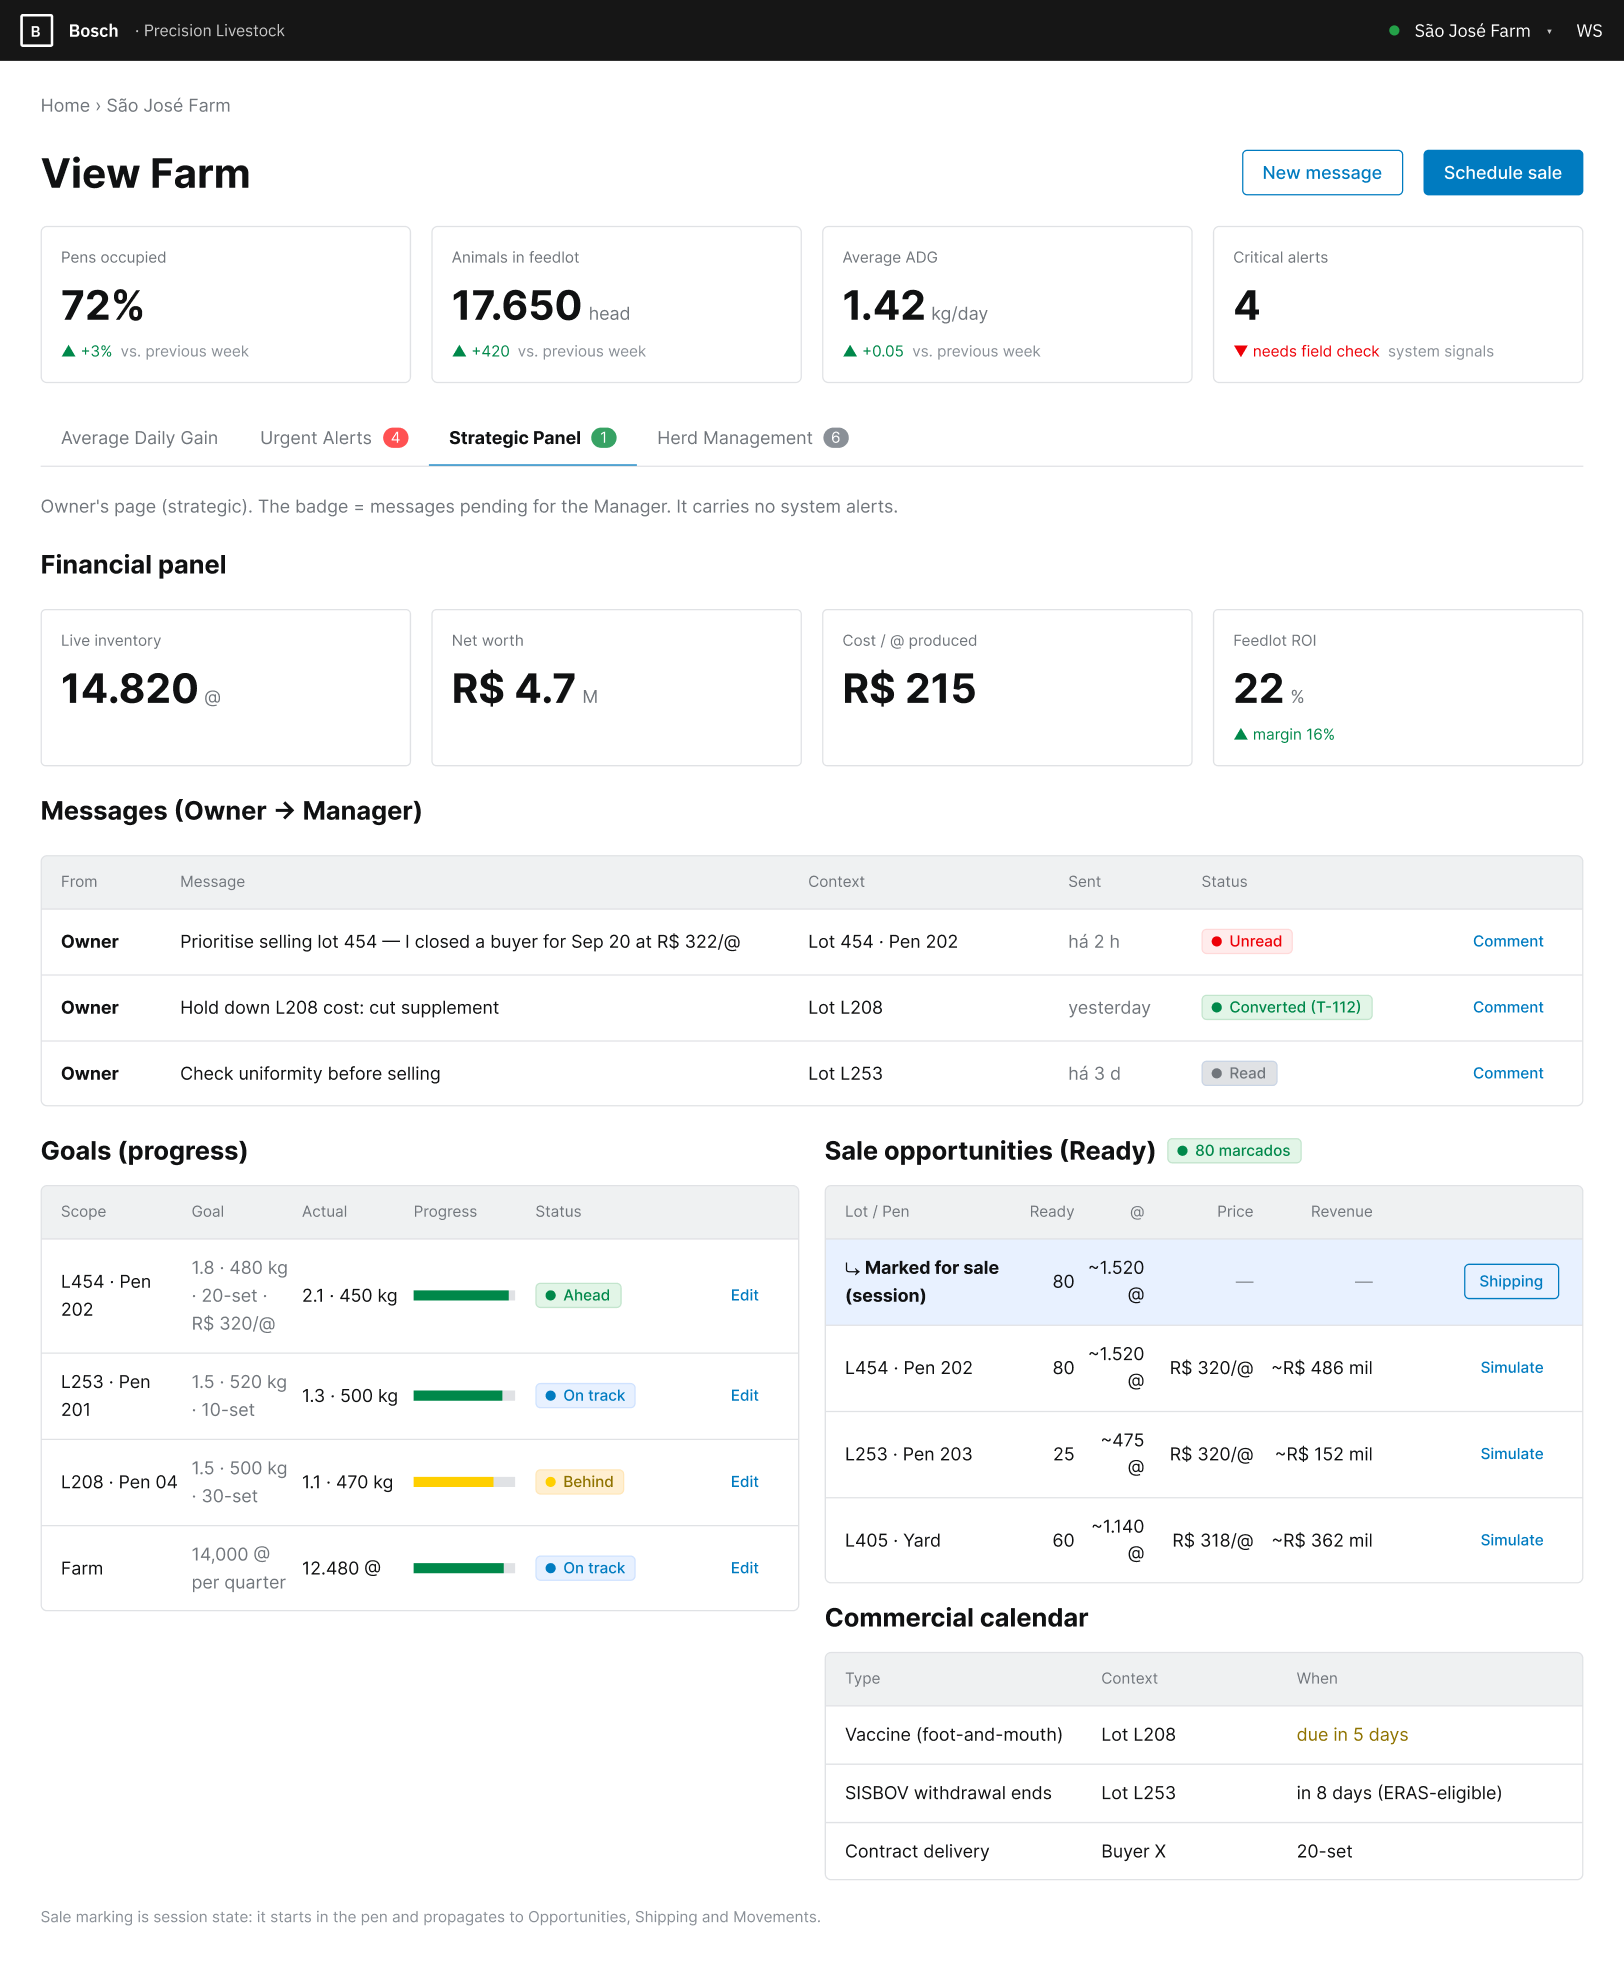
1.2 · VIEW FARM — STRATEGIC PANEL
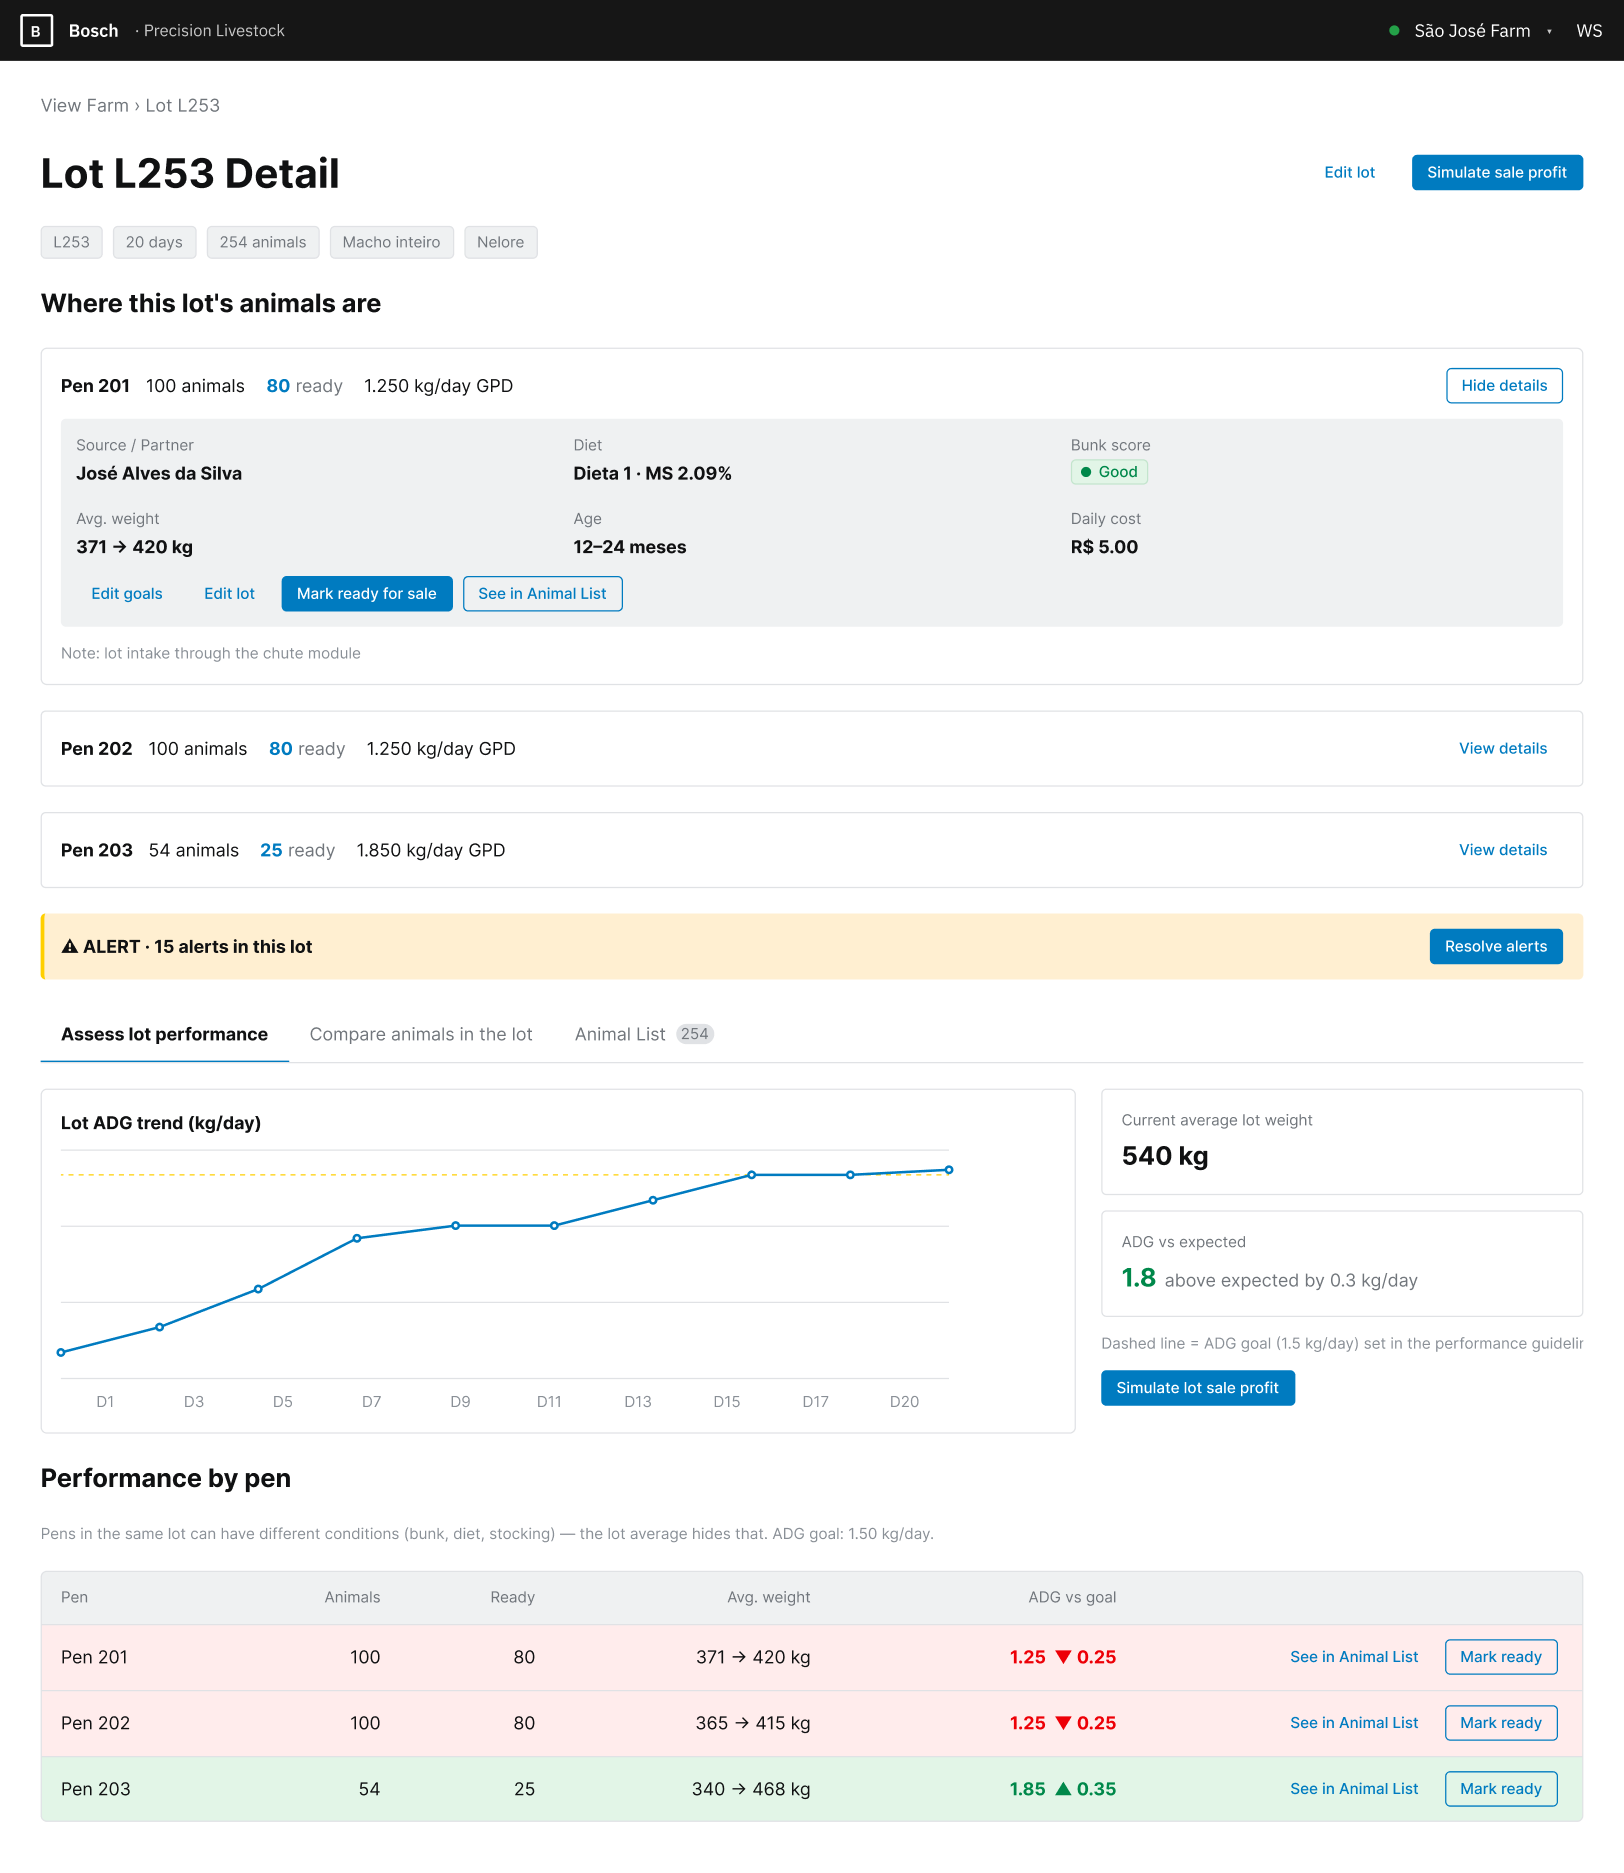
2.0 · LOT L253 DETAIL — ASSESS PERFORMANCE
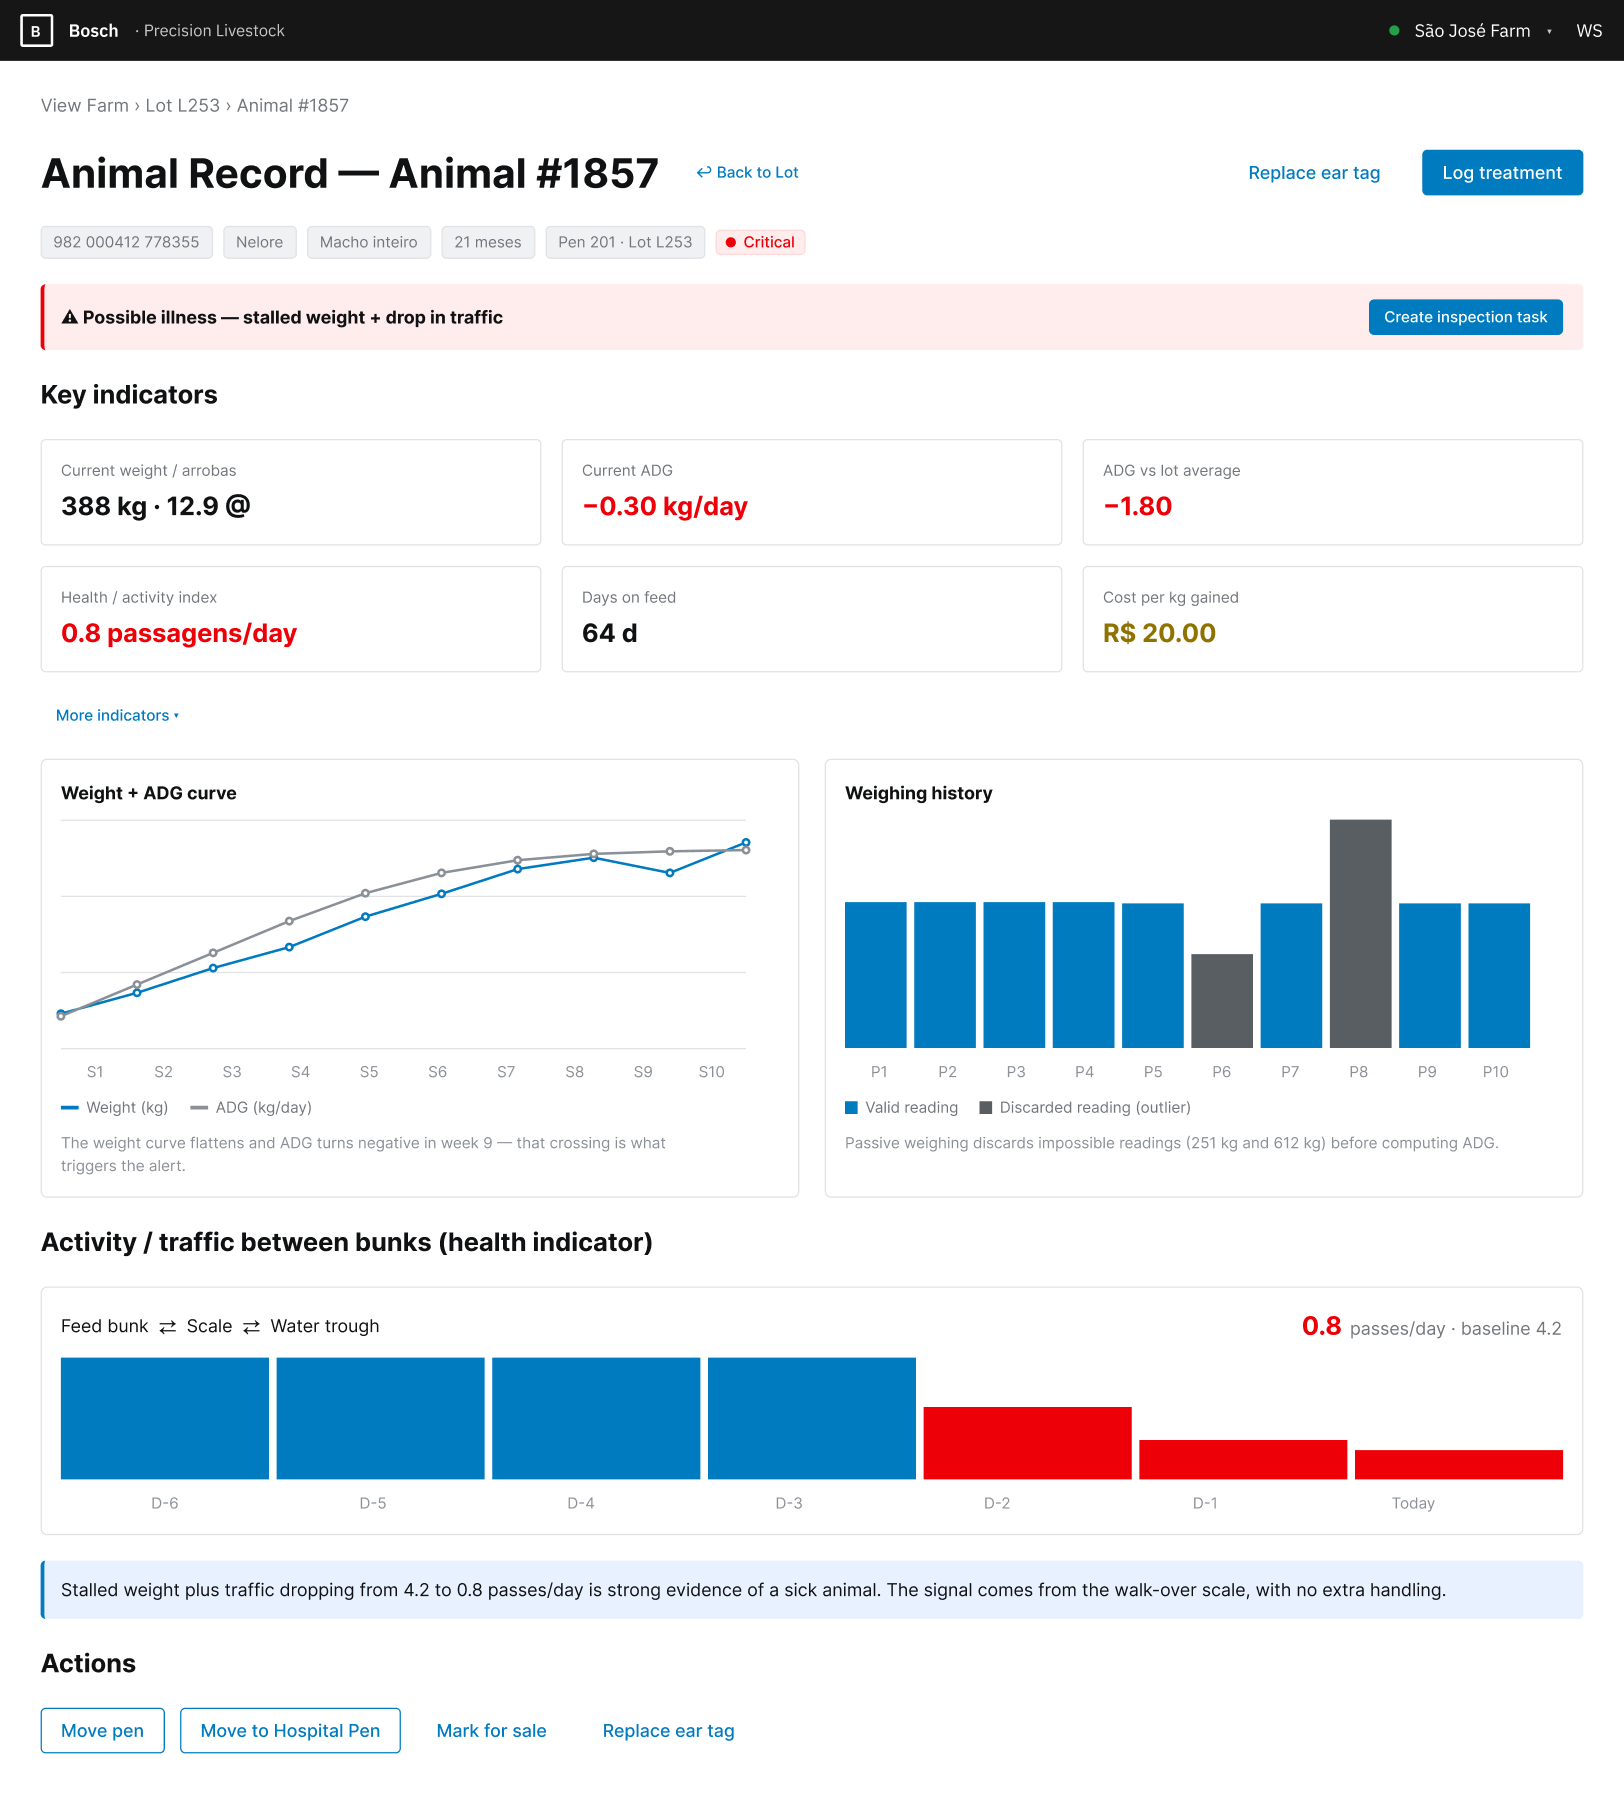
4.0 · ANIMAL RECORD — ANIMAL #1857 (CRITICAL)
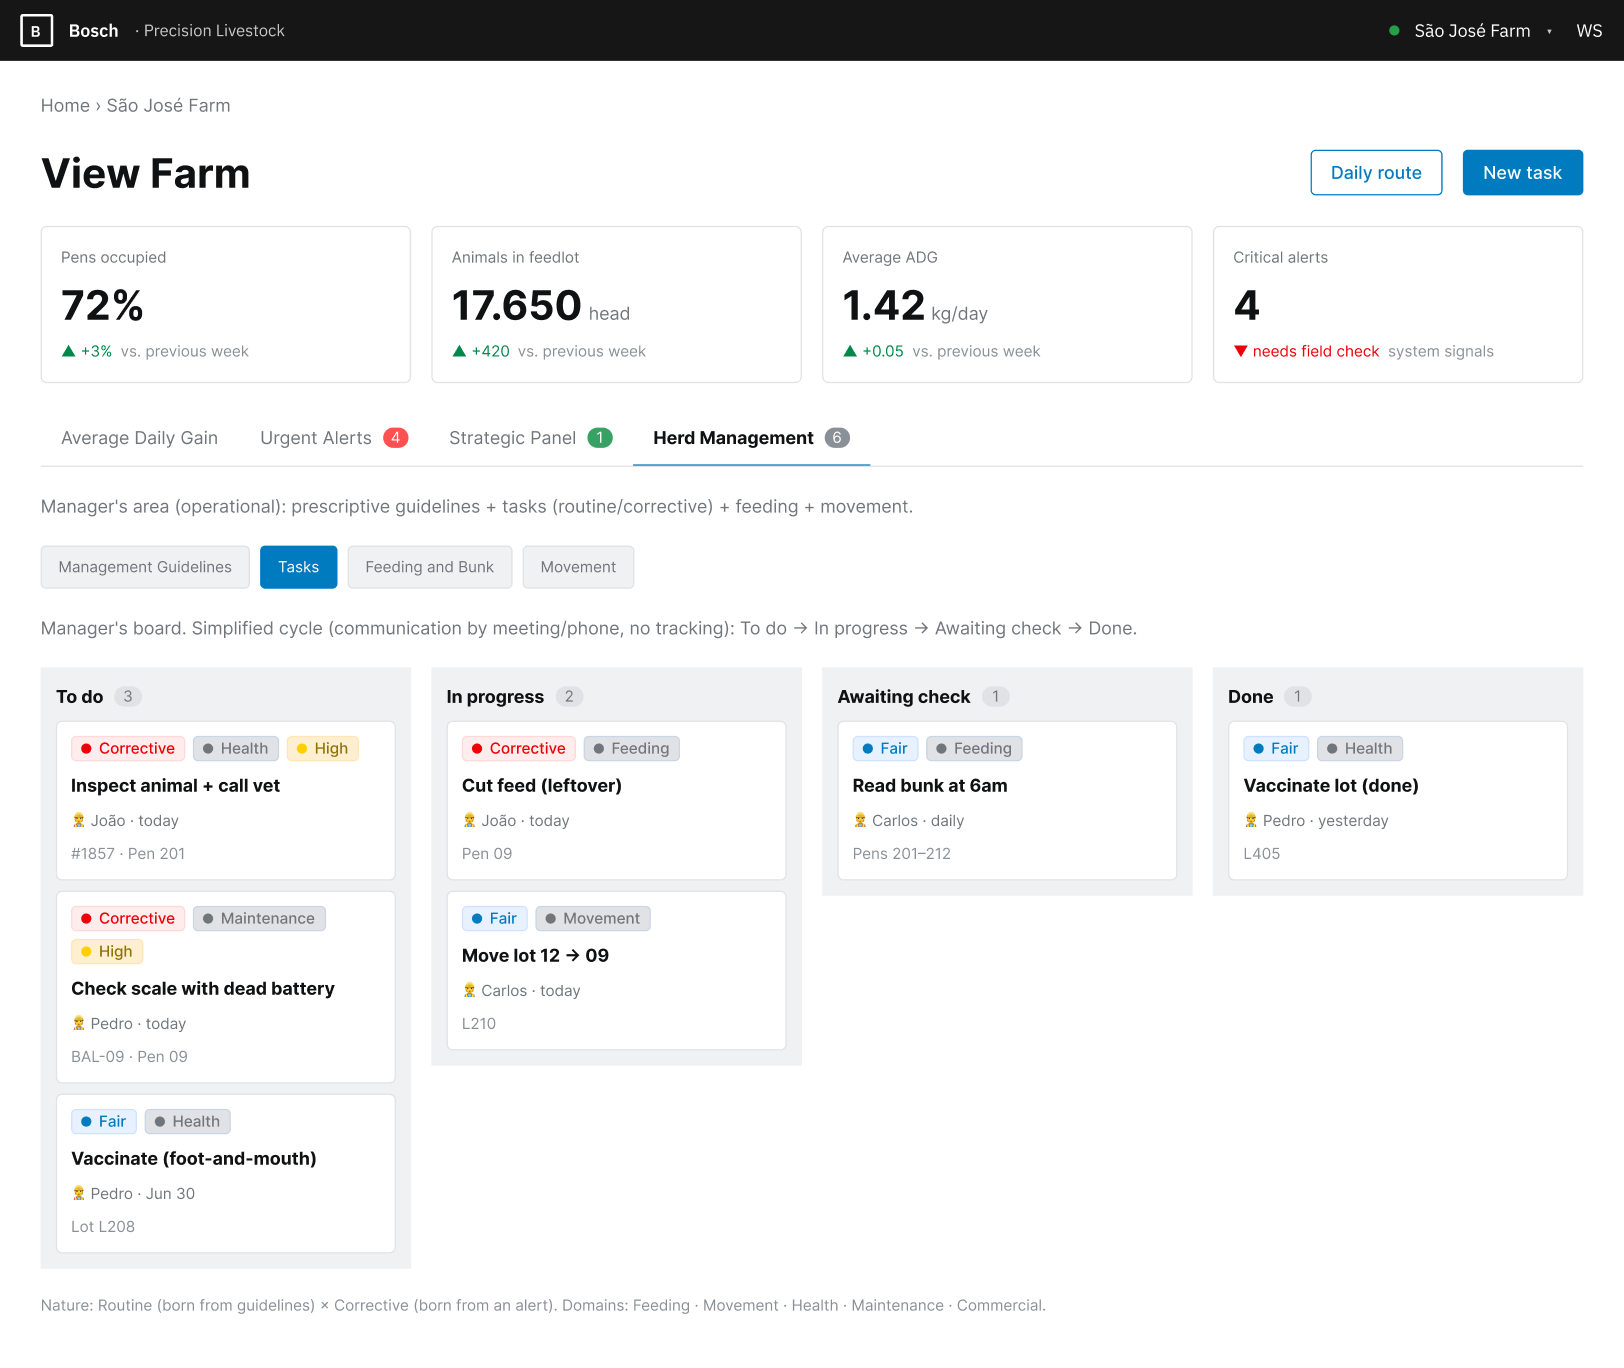
1.3.1 · HERD MANAGEMENT — TASK BOARD (T2)
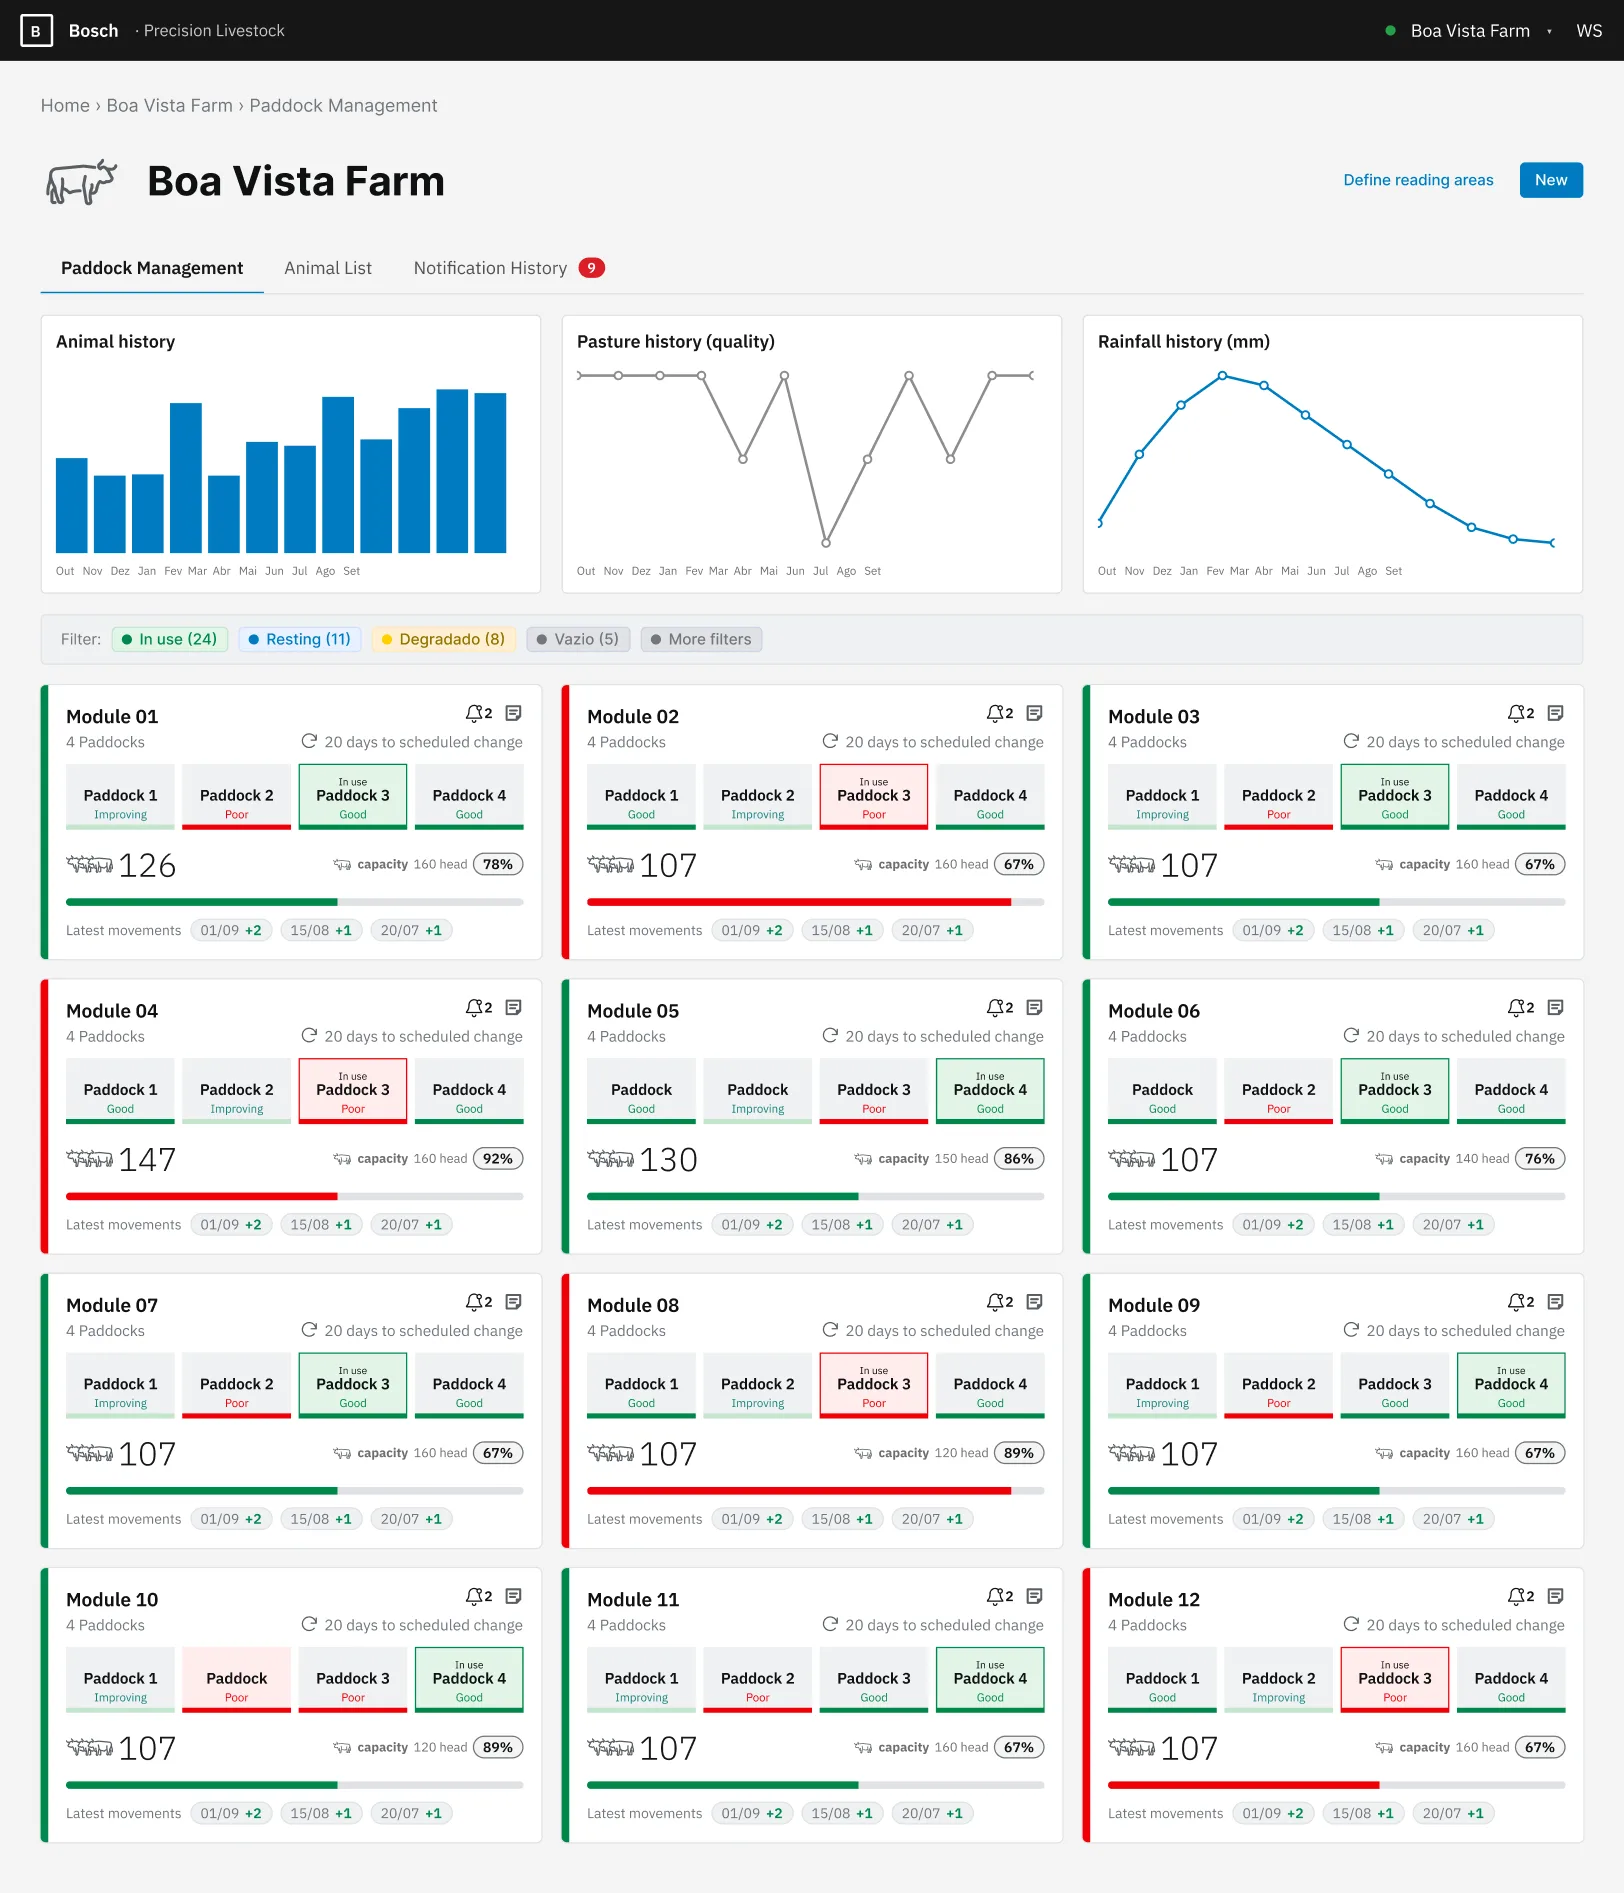
1.0 · PADDOCK MANAGEMENT — DASHBOARD
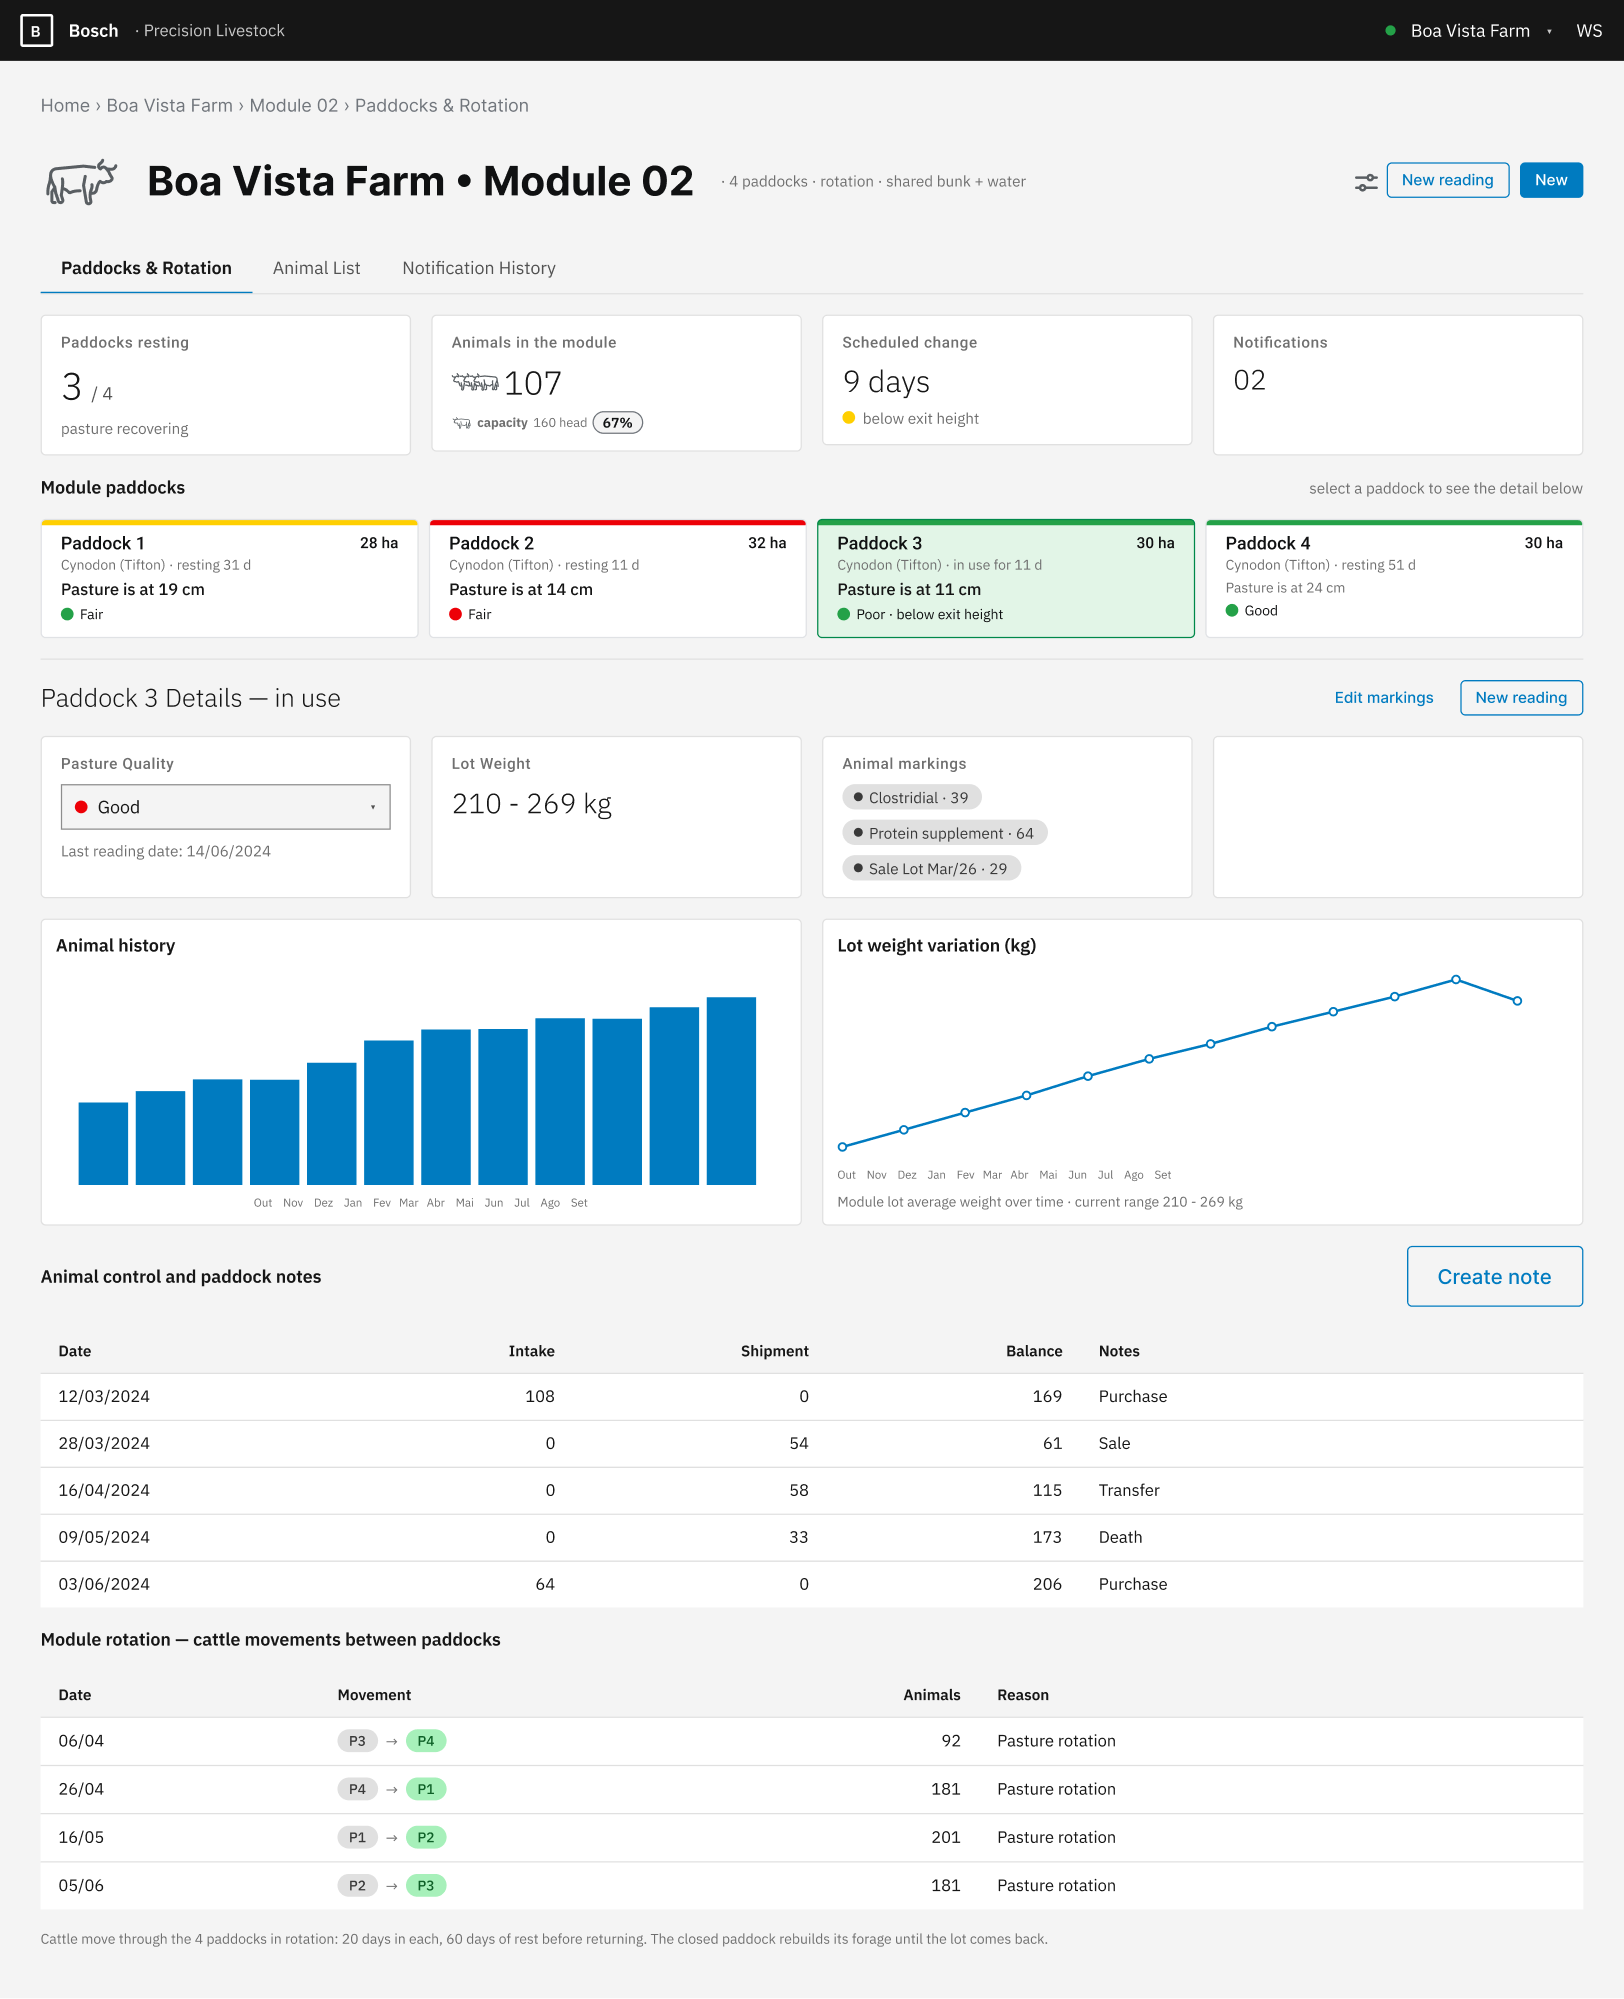
1.1 · PADDOCK MANAGEMENT — MODULE PAGE (PADDOCKS & ROTATION)
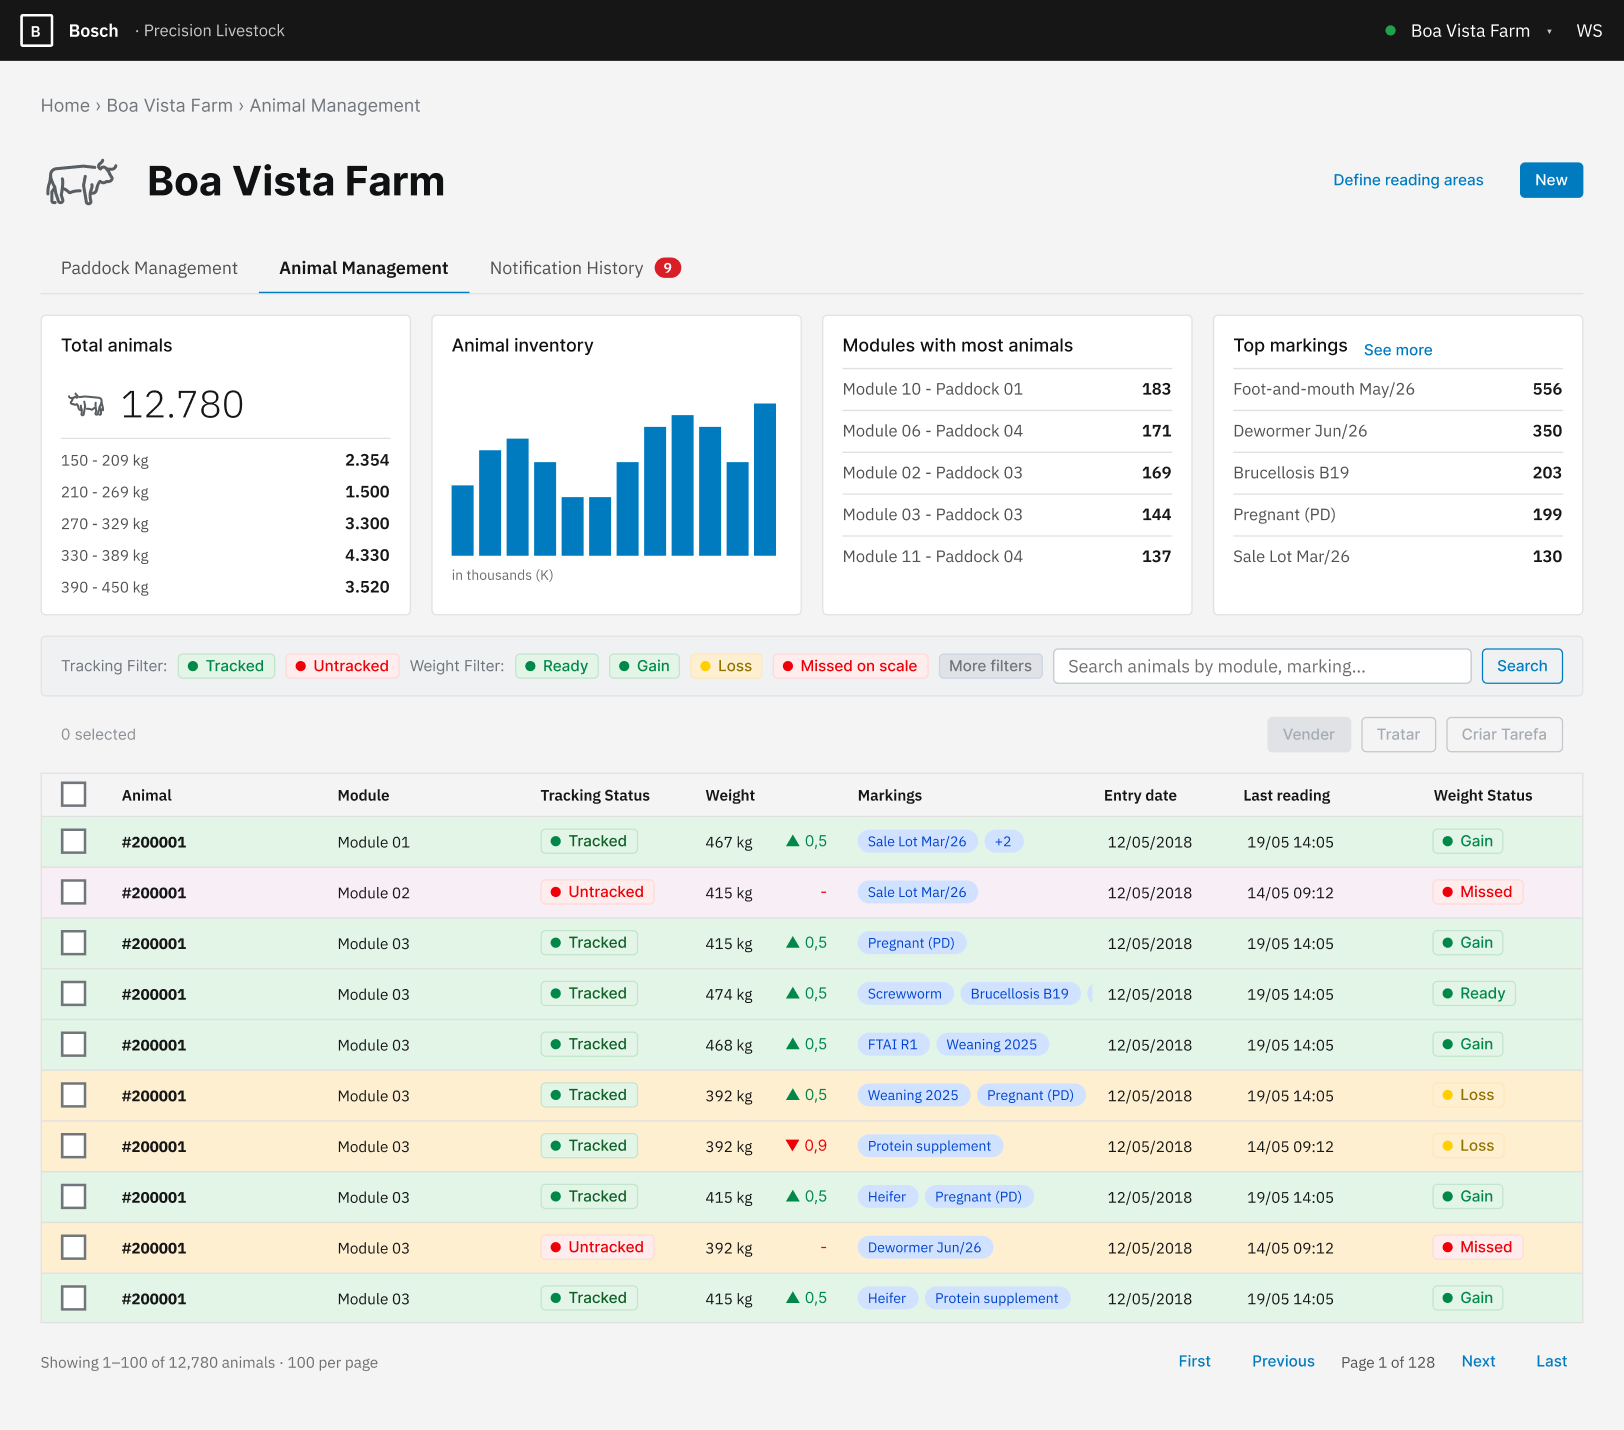
2.0 · ANIMAL MANAGEMENT — DASHBOARD AND LIST
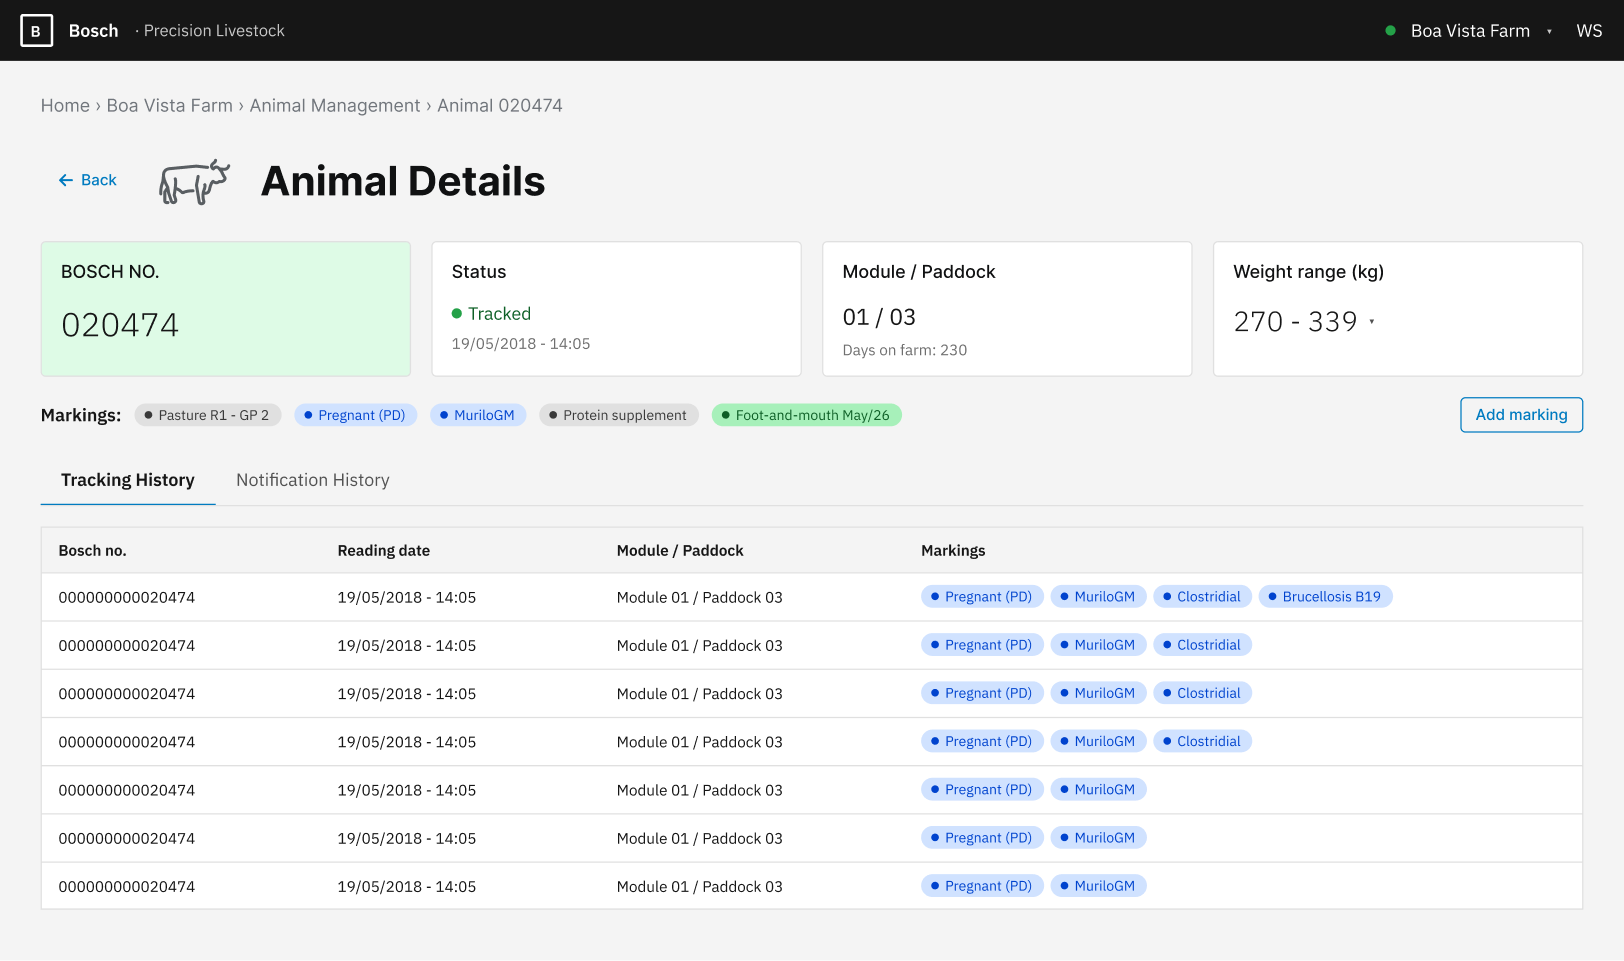
2.1 · ANIMAL MANAGEMENT — ANIMAL DETAIL
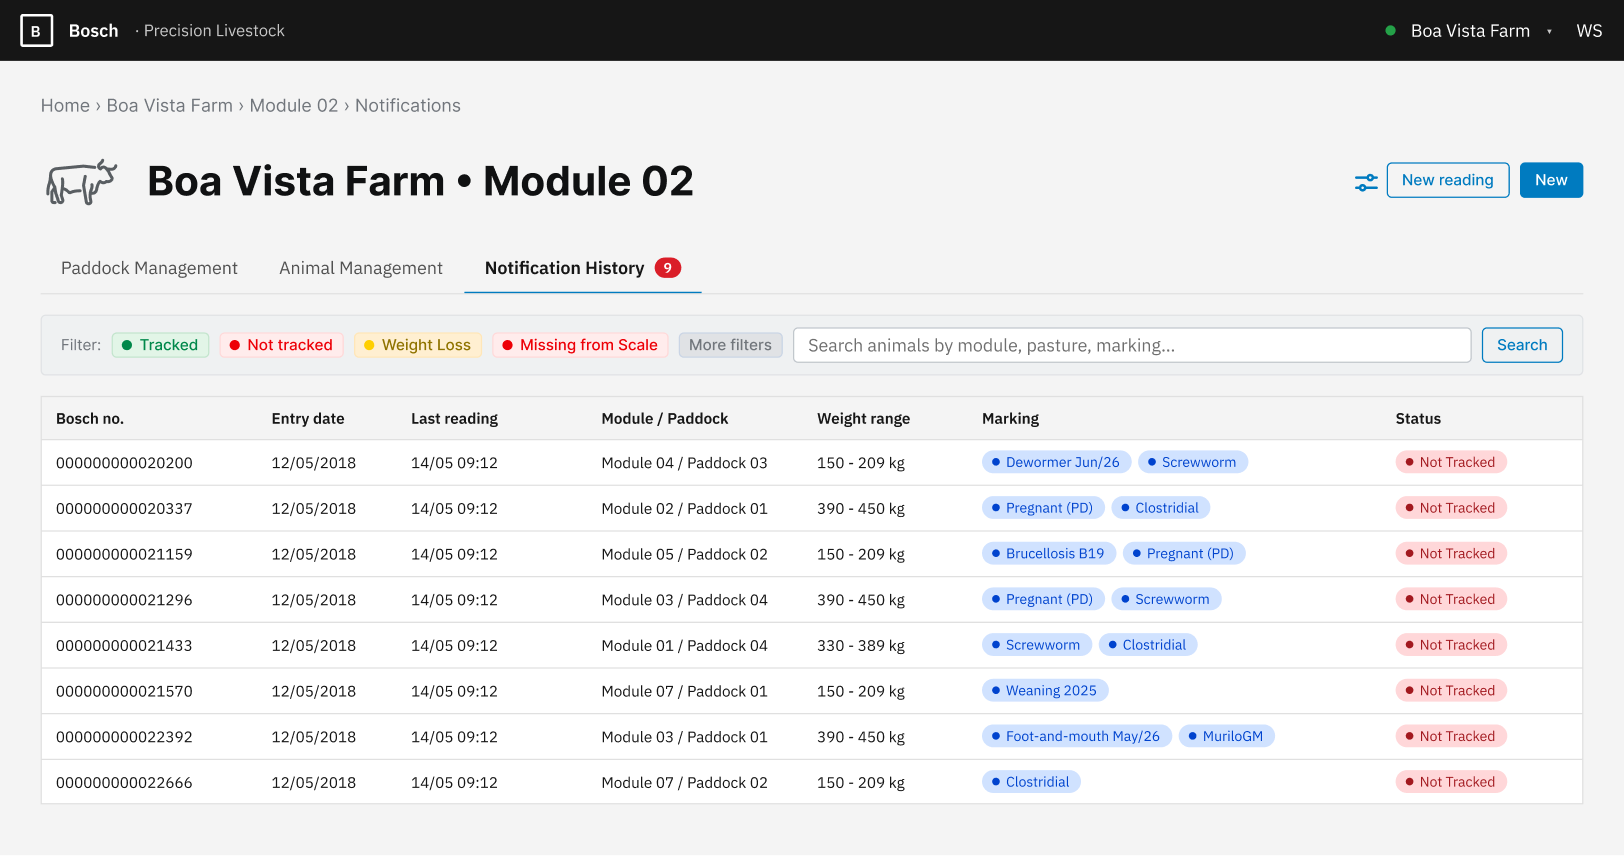
1.3 · PADDOCK MANAGEMENT — NOTIFICATION HISTORY
 1 / 4
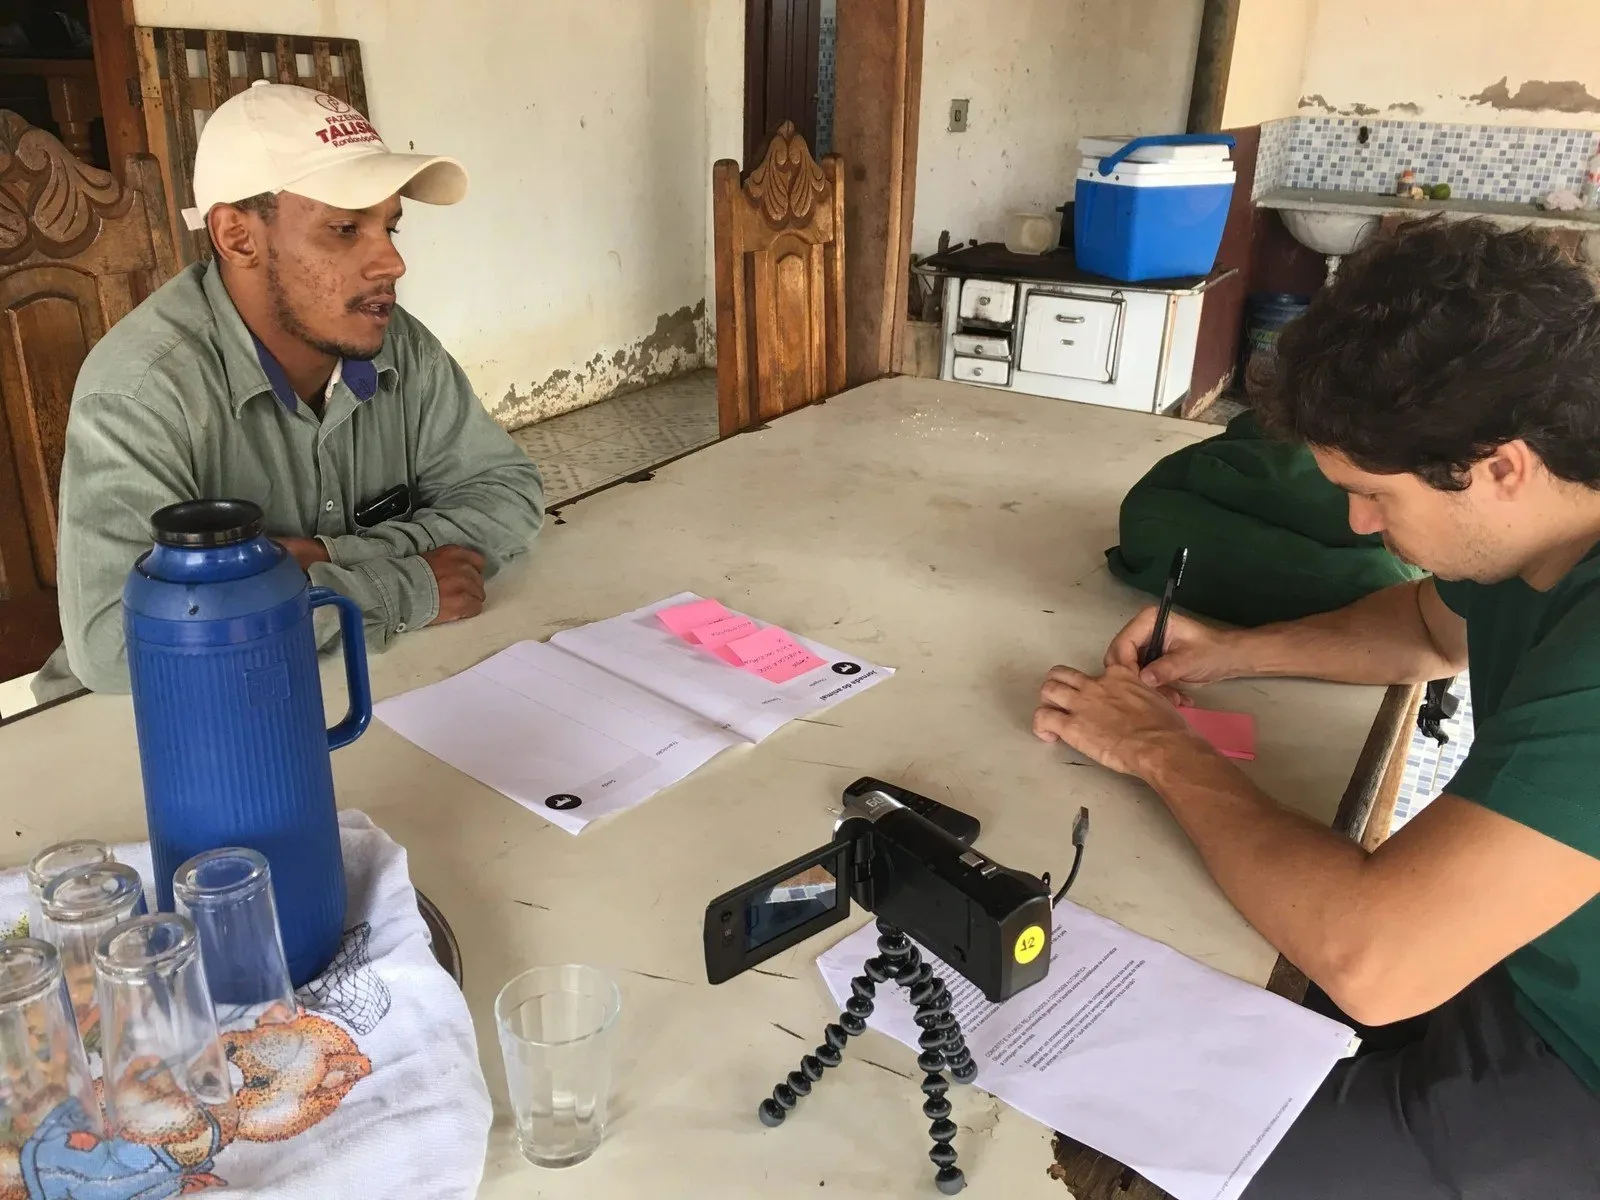
Field testing with ranchers and farm staff
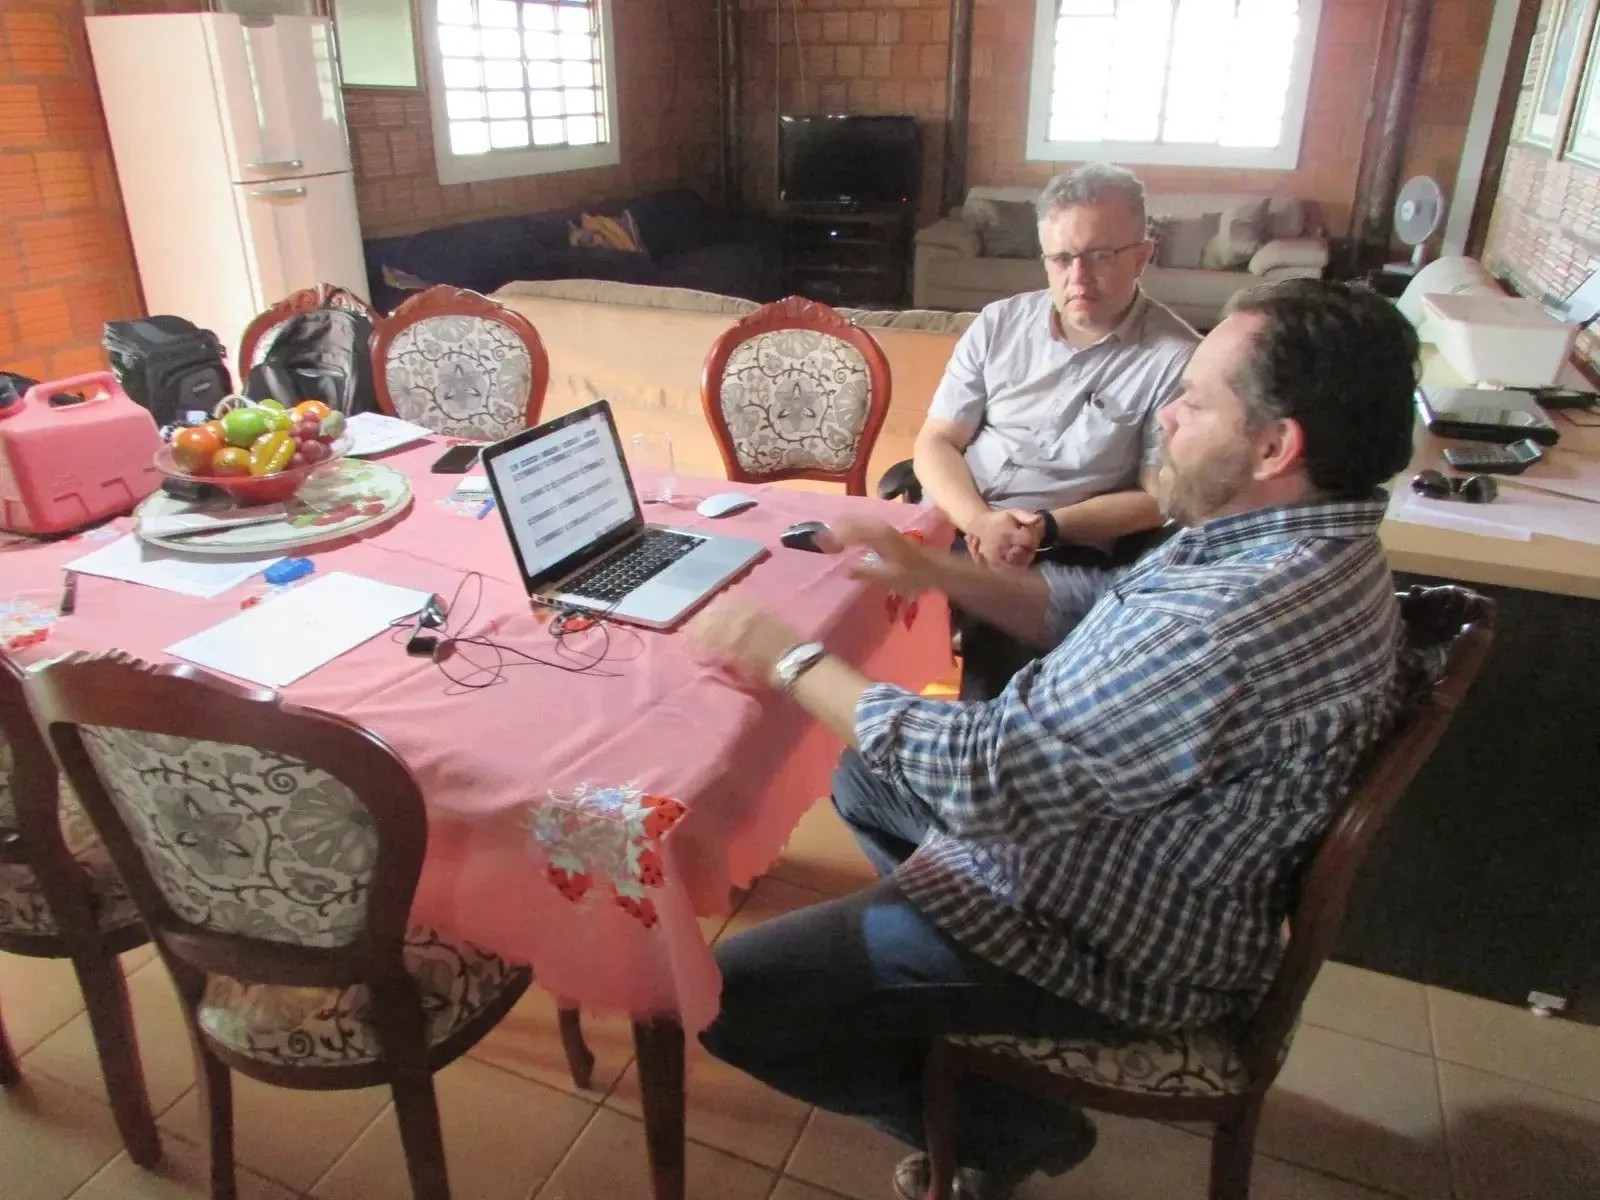
We went back to the farms to test the prototype with ranchers and ranch hands. The feedback confirmed the direction: missing-animal tracking and pasture quality drew the most positive reaction, and the screens were refined based on that input.
The rancher's question changed. Out went “how many animals are here?” and in came “what is happening to the herd and the pasture?”.
Counting cattle stopped being the product — it became the sensor. The product became near-real-time decision support over an asset that roams loose in the pasture.
Results
The same hardware stack. A different question. A different product.
Bosch's initial hypothesis — automatic animal counting — was discarded with field evidence. The product was repositioned as decision support for the rancher, aimed at the extensive system, where 95% of Brazil's cattle herd lives.
The final platform tracks what the rancher couldn't easily see: how often each animal visits the water point, its real weight every day and who has reached the ideal weight to sell, how long the herd has been in each paddock, an alert when an animal stops showing up, and pasture quality to time the rotation.
Learning
The most obvious hypothesis is usually wrong. Automatic counting seemed like the natural product for a cattle-tracking system — the field showed the value was in helping the rancher decide, somewhere no one would have found sitting in a meeting room.